
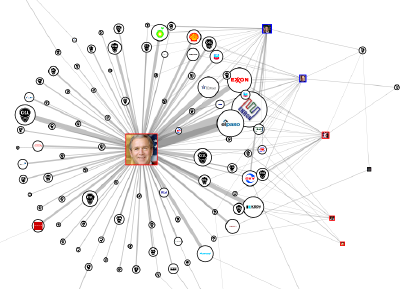
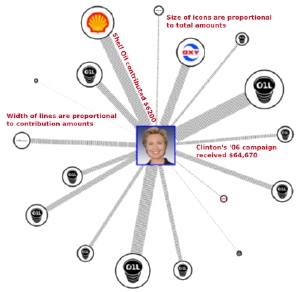
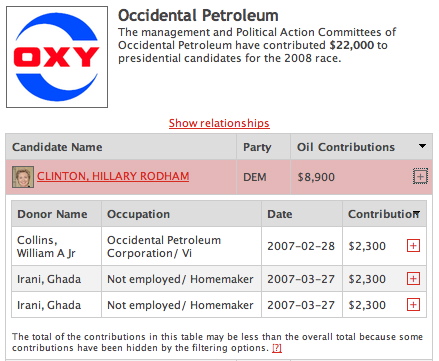
Well, it has not been officially launched yet, but the oil company campaign contribution site we’ve been working on for the last six months is live. It leaked out on blogs this week, and has been getting good reviews and tons of traffic. We are excited! The site is a project of Oil Change International and another collaboration between myself and Greg Michalec. It shows interactive network maps of campaign contributions to presidential races and members of congress. The same data is also shown in drillable tables, so you can go from a politician, to the contributing oil companies, all the way to the image of the original FEC filing. It also permits searching for congress members by name and constituent zip code.
We started work on the project all the way back in July, naively expecting that it would be a fairly simple extension of our previous unfluence.net project. However, the data from the FEC turned out to be much more complex (and much dirtier) than we expected, eventually requiring that Oil Change purchase the oil company categorizations from the Center for Responsive Politics. Greg went through some impressive mysql acrobatics. One of the big problems is the lack of consistent id systems for government data to help mash together the various databases. We got some help in this area by using data from GovTrack.us and the Sunlight foundation. The data from the FEC continued to be full of bizzare and nasty surprises, which we will hopefully detail at some point so that other people can learn from our mistakes. (Some of this is alluded to in the FAQ)
The site is a lovely example of greg’s Ajax wizardry, as there is not the slightest bit of Flash used anywhere in its construction. We’ve tried to build it as a PHP framework for wrapping the functionality of Graphviz (and other SNA programs) and linking it to mysql databases of relational information. This means it should be fairly easy to adapt it to other data in the future. ‘Tho as always, some of the elegant architecture got hacked to pieces by the specific requirements of creating a useful UI. The graphviz opensource community has been quite helpful, making several changes to their application code to add features for us.
How do you show 78,000 contributions from 6000 companies at the same time? It has been a real challenge to figure out how to present this data in ways to make it understandable for multiple audiences. I’m still not sure how to explain the filtering in ways that make sense, but we needed to have ways to trim out the ‘lighter-weight’ relations so that there were so many edges the graph turns into an uninterpretable blob. I also think it is interesting that people who are used to thinking very logically about data love the table view and hate the network maps, while many people have the opposite reaction. It is difficult to figure out how to present data to encourage relational thinking, or if it is even possible. So what we’ve tried to do is make it so people can swap transparently between alternate views of the same data.
Favorite congratulatory quotes so far:
I found the site (as a white haired non-techie granny) easy to use, informative, fast, and especially liked the take action part, which for me is related to the gestalt of the graphic info: electees from oil states (texas, la, ok) get lots of oil money. Oil money to our Oregon reps is negligible.
Are their reps who have a policy of not accepting oil money; or whose policies are such that they are not a target for oil money? (i.e. why does Wyden have no oil money in the last few years? and, in reverse, why does Gorden Smith have a great deal of oil money a few years back? Was that blip related to an issue? an out of state effort to re-elect a republican senator?
Which is more sophisticated perspective than most people usually bring, much deeper than the basic ‘who got the most’ question.
And in the bi-partisan appeal category:
OK, I had to laugh at that one, even if I am a Bush supporter. He looks like a spider sitting in his web! [blog comment in response to the prez ’00 and ’04 images]
The next steps on the project will be to continue to improve the UI, and add data and additional views to show candidates voting records on oil-related bills, and committee memberships. Also expansion to include state-level contributions. Hopefully we won’t have any more major data bugs to tackle…
Some personal thank-yous:
(somehow I feel like we’ve finished, ‘tho we are probably only starting round II…)
- my girlfriend NK for tolerating the absurd amount of time we put into the project
- our housemates, for dealing with a living room that transforms into an office without notice
- Steve Kretzmann and Trina Zahller at Oil Change for giving us the chance to make this tool and pushing to get it right
- greg, for having the fanatic attention to detail and willingness to function without sleep
- and Adam Chew for coming through with some just-in-time graphics
P.S. A request:
One of the most important contributors is the tightly held Bass Brothers oil company. So secretive, we can’t even find a logo for them to put in the network. How about it folks, somebody want to take a picture of the logo on their headquarters in Texas and send it to us?
3 thoughts on “Follow-the-oilmoney lives!”