Interesting project EVA with goal of creating a semi-automated system for parsing and extracting corporate relationships from SEC 10-K filings, ‘tho they did use some existing ownership dbs as well. Software uses a nice technique of identifying paragraphs likely to contain owership information and presenting to user for verification. Seems that much of the work was done in 2001, I can’t tell if it is an ongoing project. 
I’m not clear from the paper how they deal with name disambiguation, mergers, names changes, etc. The more extensive system explanation here suggests they also includ the time (quarter) information
from abstract:
“…a prototype system for extracting, visualizing, and analyzing corporate ownership information as a social network. Using probabilistic information retrieval and extraction techniques, we automatically extract ownership relationships from heterogeneous sources of online text, including corporate annual reports (10-Ks) filed with the U.S. Securities and Exchange Commission (SEC). A browser-based visualization interface allows users to query the relationship database and explore large networks of companies. Applying the system and methodology to the telecommunications and media industries, we construct an ownership network with 6,726 relationships among 8,343 companies.”
Authors (Kim Norlen, Gabriel Lucas, Mike Gebbie, John Chuang, were at all Berkley School of Information Management) have made a dataset availible for the telecom industry, it includes node and edge records, but not time. Data is not very clean. Lots of blank lines, and alternate wordings of company names have not been matched up.
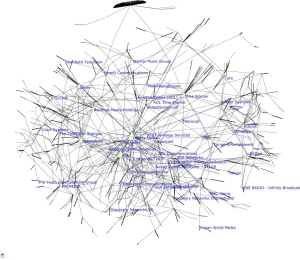
Out of curiousity, I cleaned it up enough to run it through Pajek. I was able to create a very rough image of the largest central component.

The funny star at the top is the cluster of hispanic radio stations.
In the project description they give an example of a media ownership map published in Brill’s Content Magazine. (Ironically, the magazine no longer exists, it seems to have been devoured by a merger in 2001)

Overall, I think the approach is very clever, good candidate for getting more hard data for getting data on corporate relations in general, and looking at media consolidation and ownership in particular…
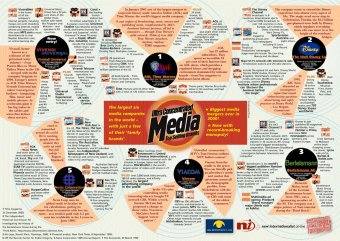
 And in that same direction, found some “info-graphics” dealing with issues of media consolidation, from around the same time period. I don’t think they are using the same data set.
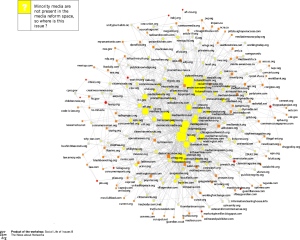
Also, the IssueNetwork project at govcom.org has some nice maps of news stories and hyperlink structures among various media outlets concerned with media reform:


A pseudo-network browseable diagram of ownership by some of the big players:
http://www.pbs.org/wgbh/pages/frontline/shows/cool/giants/
by pbs?
A very very nice timeline view of communication industry mergers:
http://www.alrdesign.com/blog/uploaded_images/map-764515.jpg
Hi Skye,
http://www.alrdesign.com/blog/2007/03/media-consolidation-visualization.html
That [timeline of industry mergers] actually came from Mother Jones magazine:
Thanks for the oil map tip!
Yours,
Noah