
The ndtv package is finally up on CRAN! Here is a the output of a toy “tergm” simulation of edge dynamics, rendered as an animated GIF:
[link to movie version a basic tergm simulation]
Continue reading ndtv: network dynamic temporal visualization
Category Archives: tools
Pleasantly Perusing the Paper Pile with Pivots

A nice UI for browsing a database of academic papers: Marian Dörk’s PivotPaths. It arranges papers matching a search term along with a sort of linked tag-cloud of authors and other keywords for easy navigation. All the interaction is really nice (try dragging a line between two authors to compare them!). Papers queried from Microsoft Academic Search. Find it interesting how looking at a different database for my standard search terms reveals unfamiliar sets of papers (my vanity queries turned up nothing in the viz, tho they do have hits in Microsoft Academic Search). Would be really cool if you could point it to google scholar also to compare coverage. I like that, even ‘tho it was built at Microsoft Research, it uses open web standards! (SVG, oog). Have we reached the point where the best way to publicize a new data service is to get someone to build a viz with it? Via infosthetics.
50 nets of Grey
Just saw this really nice blog post at badhession.org explaining how to do Exponential Random Graph Modeling (ERGM) using a sexual-hookup network from the TV show Grey’s Anatomy.
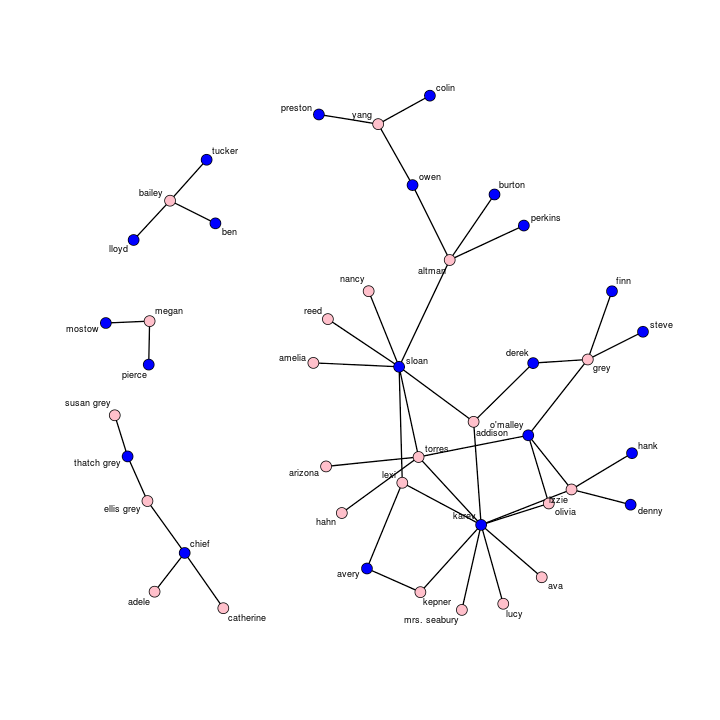
I do some work on some of the dynamics packages in statnet (‘tho not the amazing stats part demoed in the post) so its great to have something to point to explain what the project can do. Now we just need to go back and add the timing information to the edges (who was partnered in which episodes) to be able to estimate the number of concurrent partnerships and look at the epidemic-spreading potential of the network…
(via Brian Keegan)
Embedding Webs on the Web

I’ve created a page to compare various tools for embedding a network diagram on the web. I used a small example set of researchers’ keyword associations. As always, browser compatibility is a big challenge. Most of the options I tested required a fair amount of web coding ability to get them working. I’d love to hear about other tools and ideas I may have missed.
Sqooshing data onto a map

I just spent some time comparing various tools for publishing web visualizations of region-coded data. I looked at some Google tools, ManyEyes, and Tableau Public. This is what I learned using my demo example. Please let me know of any other tools I should test…
dynamicnetwork JSS Paper
Well shoot, I guess it is publication week! The special issue of the Journal of Statistical Software about the statnet package for advanced network statistics has finally been released. It is great to see the years of hard work from everyone on the statnet team finally in print! I did some work for the project to hook up the package with SoNIA software to create movies from output of statistical models of dynamic networks of disease transmission. One of the articles in the issue documents the process and includes some example movies:

Skye Bender-deMoll, Martina Morris, James Moody (2008) “Prototype Packages for Managing and Animating Longitudinal Network Data: dynamicnetwork and rSoNIA” Journal of Statistical Software. Vol. 24, Issue 7.
One of the exciting things for me about the project was exploring ways to display time, connectivity, and transmission simultaneously. An example of one of the movies demonstrating the effects of varying levels of “concurrent partnerships” on the paths of transmission of simulated “infection”: (70mb quicktime movie). In the last few frames of the movie, the perspective shifts to show a timeline image of the infection “trees” in occurring in the simulated network.
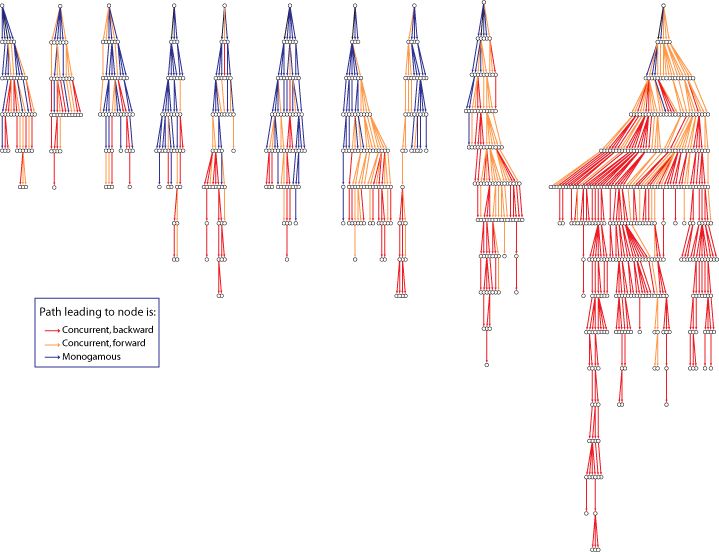 In the tree image (created by James Moody) time advances vertically down the page, so the seed nodes for each infection appear at the top and the “depth” of the tree indicates the time step of the infection. The color of each edge indicates the concurrency status of the corresponding relationship when the transmission occurred.
Grassroots network mapping
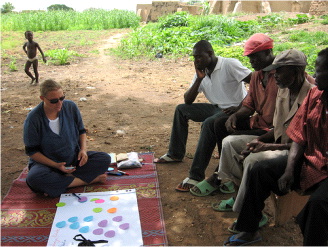 I’m working on a project for AAAS’s Science and Human Rights Program to identify some possibilities for human rights uses of networks and network visualization. In the process of doing a quick web review of existing work, I located a couple of interesting examples of people using networks as a grassroots tool to help stakeholders develop analysis of the power networks they are embedded in as a strategy tool. Also great to see such a low-tech solution.
Continue reading Grassroots network mapping
API access to US state political funding data
 The National Institute on Money in State Politics now provides a service where users can submit queries and download data in xml format. The documentation for the service (which requires setting up an account login) is here.
They also include services for generating various graphic reports including a Political Contribution Logorithmic Scatterplot Profile with interactive javascript inspection of candidates.
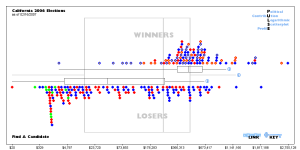
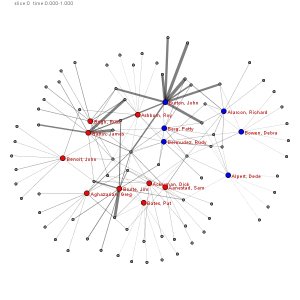
I did quick cut-and-paste from another site which uses thier data, and was able to generate network maps of the top tend funders for a few california candidates. But with access to the full DB via the API, it is possible to do much more sophisticated maps and even animations – for most states they have data going back several years.
Network Data Formats Wiki
 Several weeks ago I created wiki to archive discussion and documentation of the various formats for storing network data, hopefully leading to future work converging on some common standards. For now, it is a quick-and-dirty archive to collect and sumarize information about data formats and software for Social Network Analysis and related fields. Most of the material has been lifted from an interesting discussion on the SOCNET listserv. Please feel free to edit and add to documentation, especially if you are the author of any of the formats (or to fix my spelling ;-) Hopefully this could move to a more centralized server at some point…
Krugal Code Search Engine
Krugal seems to be a nice project for searching code snips and algorithm implementations. Currently mostly sourceforge stuff, I found some very familiar code ;-) also alternate implementations I’d like to look at in detail
Krugle is designed to locate code. Krugle supports code search by crawling, parsing and indexing code found in all open source repositories, as well as code that exists in archives, mailing lists, blogs, and web pages. (http://corp.krugle.com/product/index.html)
Definitly still in beta, but seems to work pretty well.