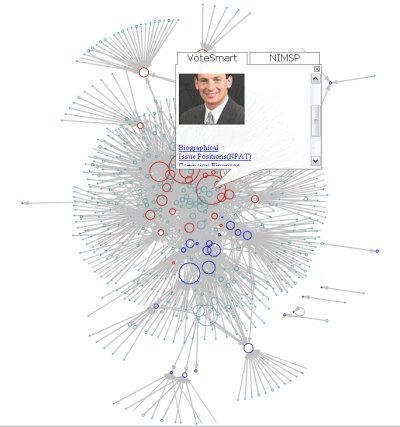
This was done as an entry in the Sunlight Foundations Mashup Contest. Cross your fingers that we win and get some resources to continue the project! ;-) Continue reading Unfluence Project Launched!→
PajekConverter is a basic utility (written in Java) for converting tab-delineated text files into a format readable by the network analysis and visualization software Pajek. Pajek is Windows-based freeware, written by Vladimir Batagelj and Andrej Mrvar, University of Ljubljana, Slovenia Downloadable from: vlado.fmf.uni-lj.si/pub/networks/pajek/
PajekConverter was written by skye for John Padgett, University of Chicago.
Bugs and Questions to: skyebend@santafe.edu
Dr. Martina Morris (PI) & Dr. Mark Handcock at the Center for Studies in Demography and Ecology of University of Washington are funding a SoNIA-related project contract to integrate dynamic network visualization techniques with the R statnet package developed by Morris, Handcock, et al at the CSDE. The funds come from the NIH grants supporting the Network Modeling Project at the University of Washington (grants R01 HD41877 and R01 DA12831)
The focus is on adapting and developing visualization techniques for dynamic network data. The specific emphasis will be on techniques relevant for understanding:
a) infectious disease transmission (change in state of elements due to a network diffusion process) and
b) the stationary dynamics (model-based addition and removal of nodes/edges) of longitudinal network data and simulation output.
The goal is to develop robust, rigorous and repeatable procedures for visually interpreting time-based network data. We will achieve this by linking existing software components and improving existing techniques to generate animations and export movies from R or other statistical packages into standard formats suitable for use in presentations or websites.
I worked for a year or so as a consultant at ATA SpA in Lucca Italy. ATA (now defunct) was a academic spinoff/tech startup that works with various kinds of networks. Especially networks relevant to the bio-pharma industry, such as patent citations, term co-occurrence in medical journal abstracts, co-authorship, etc. Overall the goal was to come up with systematic techniques for creating overviews research domains (or other proprietary DBs) that allow the user to locate interesting regions and then inspect the underlying data. This is an area many researchers are focusing on, but I think part of what was innovative about ATA’s Dynet project was its focus on networks that are evolving in time.
Dan McFarland is professor in Sociology/Education at Stanford. He has collected lots of “streaming” interaction data of students in classrooms. The data can be used to generate networks with very high temporal resolution (< 1 min). I worked on data processing scripts in java, analysis in R, and on developing visualizations. We also began the SoNIA project partially as a tool for working with this data. Some of the work ended up in publications, available from Dan’s website. Movies showing the networks evolving in time (and more details about the data) are on the SoNIA project page.
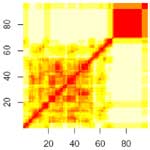
The figure here is a distance matrix of conversation networks extracted as 2.5 minute sliding windows for one class period. Each row (or column) of the matrix shows the comparison of a single slice network to all of the others. White indicates large differences between networks, red means low. Time moves from the lower left to the upper right, so the red diagonal shows that each slice is similar to itself. This picture seems to show a period of varying structure for the first 2/3 of the class, and a final segment that is very different.
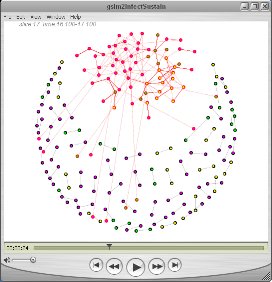
SoNIA is a Java-based package for visualizing dynamic or longitudinal “network” data. By dynamic, we mean that in addition to information about the relations (ties) between various entities (actors, nodes) there is also information about when these relations occur, or at least the relative order in which they occur.
In January 2003, before the start of the current war in Iraq, a group of people in San Francisco began experimenting with ideas of how to respond to the newly increased level of rhetoric and propaganda surrounding issues of US national security. The goal was to sensitize people to the threats to civil liberties implied by the (then) newly proposed government projects such as the renamed, repackaged and re-budgeted “Total Information Awareness” program, while at the same time doing outreach to provide political organizing materials to people on the street in a humorus and provocative way. Continue reading DeptHomelandSecurity.com→
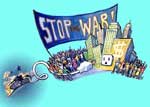
DASW was an SF Bay-area umbrella group for coordinating non-violent direct action against U.S.-lead wars for global domination. Using classic “spokes-council” organizing model, thousands of people were able to coordinate their actions well enough to shut down the SF financial district during the first days of the invasion of Iraq. More than 2000 people were arrested or detained over several days of protest, only a handful were even charged of any crime. The website provided analysis, calls to action, and some information on legal support and non-violent direct action organizing. Although the guts of the website was written by others (DT) I assisted with content management.
A loose affiliation of radical street musicians. The BLO has helped support a large number of actions and issues in the SF bay area over the last several years. Including helping to shutdown the SF financial district during the protests at the beginning of the Iraq war. Since I don’t actually play a horn, I started out playing snare and now a very large surdo. But I’m kind of a “band member at large” as I’m often not in the bay area.
The BLO plays a strange mix of music, but lots of influence from various balkan brass bands and creative arrangements of political music from different ages and movements. There is more information, sheet music, etc on the website.
There seems to be increasing numbers of bands like this in the US, which I find very exciting. Were are beginning to join the international sisterhood of radical brass bands. Groups like the now disbanded Infernal Noise Brigade from seattle, the Hungry March Band and Rude Mechanical Orchestra from NYC. There is now a US email list for interested street band folk, and hopefully this fall we will have the first sbandata-style party (sbandapaloza?) in the form of the HONK festival in Boston.
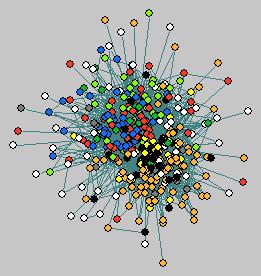
PajekAnimator provides a crude way of animating the structural transitions between network layouts at different points in time. The intention is to assist the eye in discovering relationships by providing clear cues about node “movement” using sinusoidal interpolation of the coordinates of nodes at successive points in time. PajekAnimator is a hacked together chunk of Java code meant to be used as a utility /demonstration of concept in conjunction with the network visualization and analysis software, Pajek.
Pajek is Windows-based freeware, written by Vladimir Batagelj and Andrej Mrvar, University of Ljubljana, Slovenia Downloadable from: vlado.fmf.uni-lj.si/pub/networks/pajek/
PajekAnimator was written by skye for John Padgett, University of Chicago.
Bugs and Questions to: skyebend@santafe.edu


 The figure here is a distance matrix of conversation networks extracted as 2.5 minute sliding windows for one class period. Each row (or column) of the matrix shows the comparison of a single slice network to all of the others. White indicates large differences between networks, red means low. Time moves from the lower left to the upper right, so the red diagonal shows that each slice is similar to itself. This picture seems to show a period of varying structure for the first 2/3 of the class, and a final segment that is very different.
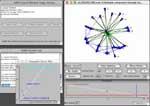
 DASW was an SF Bay-area umbrella group for coordinating non-violent direct action against U.S.-lead wars for global domination. Using classic “spokes-council” organizing model, thousands of people were able to coordinate their actions well enough to shut down the SF financial district during the first days of the invasion of Iraq. More than 2000 people were arrested or detained over several days of protest, only a handful were even charged of any crime. The website provided analysis, calls to action, and some information on legal support and non-violent direct action organizing. Although the guts of the website was written by others (DT) I assisted with content management.
 A loose affiliation of radical street musicians. The BLO has helped support a large number of actions and issues in the SF bay area over the last several years. Including helping to shutdown the SF financial district during the protests at the beginning of the Iraq war. Since I don’t actually play a horn, I started out playing snare and now a very large surdo. But I’m kind of a “band member at large” as I’m often not in the bay area.