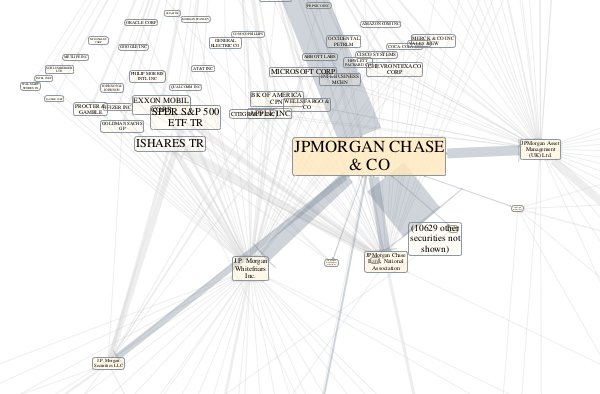
Inspired in part by recent work for a client, I finally got around to pulling a long night to play with some Form 13F data from the SEC. This pdf image shows significant ownership relations for J. P. Morgan at the end of 2010. Or at least I think it does. I’d love to hear from anyone who knows more about these types of financial filings.
As I understand it, the SEC requires anyone who manages more than $100 Million in securities to file a 13F report quarterly detailing how much they own of each type of security. They also publish a giant list of securities that must be reported, along with a CUSIP id for each one. The CUSIP ids “are used with permission by Standard & Poors CUSIP Service Bureau, a division of The McGraw-Hill Companies, Inc.” and come with an accompanying prohibition on reuse and redistribution which seems strange for Federal public filing documents. I think that the assets listed are all ownership of securities in “real” companies — so probably excludes index funds, mutual funds, and the sort of complex trading instruments that reportedly lead to J. P. Morgan’s recent newsworthy losses. But i think it is still intriguing to peek at some of the complexity.
J. P. Morgan’s file for the end of 2010 states that contains data for 10 managers, so I assumed that the manager number for each row indicates which subsidiary actually owns the security, and summed the value column to control line widths and node labels sizes. The network had ~2k nodes which was kind of busy, so i filtered it down to show only relationships of more than $100,000, reducing it to ~200. I cleaned and formatted the raw filing data in a text editor, processed it with R and ran through Graphviz to create a pdf image.
Some Questions & Things I Found Interesting:
- It seems like the total ownership in these forms is greater than the capitalization value of some of the companies. Is this crazy leverage, or am I just double counting somewhere?
- In some places there is a trail of ownership that leads back to the parent. (These edges are not shown in this image because they were removed by the $100k threshold) Is this hedging or something?
- There are lots of situations where the various management arms own stock in the same entities. Probably not a serious issue, but must make calculating risk exposure to specific securities really hard.
- This bank seems to own stock in lots of other banks, each of which probably has an equally complicated network of overlapping security ownerships.
- As might be expected with any real-world data, The CUSIP ids seem to have some format errors, and the names of companies don’t follow consistent spelling and normalization with the SEC’s CIK names.
It seems like it might be kind of tricky, but not impossible, to scrape all of this into a free database, similar to what we did with the subsidiary data from the 10K filings…
I have a newfound respect for corporate accounting, and the challenges of financial oversight :-)


Someone in the financial sector wrote via OpenCorporates (http://opencorporates.com) to give a bit more insight into what the 13F filings really mean. A key point being that the ties should be thought of as investment decision-making authority, not ownership.