The National Institute on Money in State Politics now provides a service where users can submit queries and download data in xml format. The documentation for the service (which requires setting up an account login) is here.
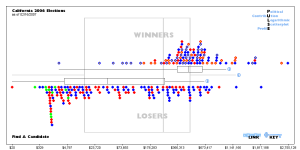
They also include services for generating various graphic reports including a Political Contribution Logorithmic Scatterplot Profile with interactive javascript inspection of candidates.
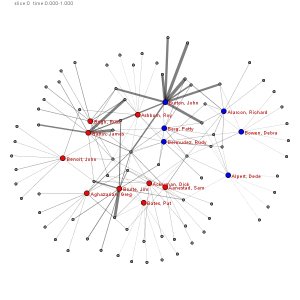
I did quick cut-and-paste from another site which uses thier data, and was able to generate network maps of the top tend funders for a few california candidates. But with access to the full DB via the API, it is possible to do much more sophisticated maps and even animations – for most states they have data going back several years.
Its not what they say during the campaign that counts…
..its what they do in office. The nice thing about politicians is, a lot of what they do is a matter of public record, increasingly available on the internet for free. Wouldn’t it be great if ordinary people had the tools to make this political landscape visible?
I’m posting here some examples I’ve come across of intriguing maps and representations of political data. Mostly these fall under the broad heading of “mapping congress” based on data available from the THOMAS db of congressional record.
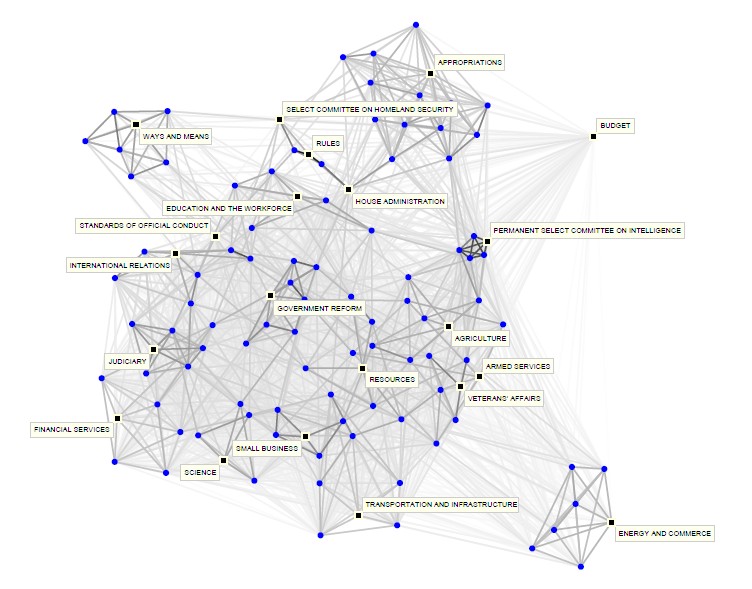
Committee Interlocks
I found a nice preprint in arXiv that explores the hierarchical relationships formed by the pattern of overlap of Representatives in committees:
Interesting project EVA with goal of creating a semi-automated system for parsing and extracting corporate relationships from SEC 10-K filings, ‘tho they did use some existing ownership dbs as well. Software uses a nice technique of identifying paragraphs likely to contain owership information and presenting to user for verification. Seems that much of the work was done in 2001, I can’t tell if it is an ongoing project. Continue reading Extraction, Visualization & Analysis of Corporate Inter-Relationships→
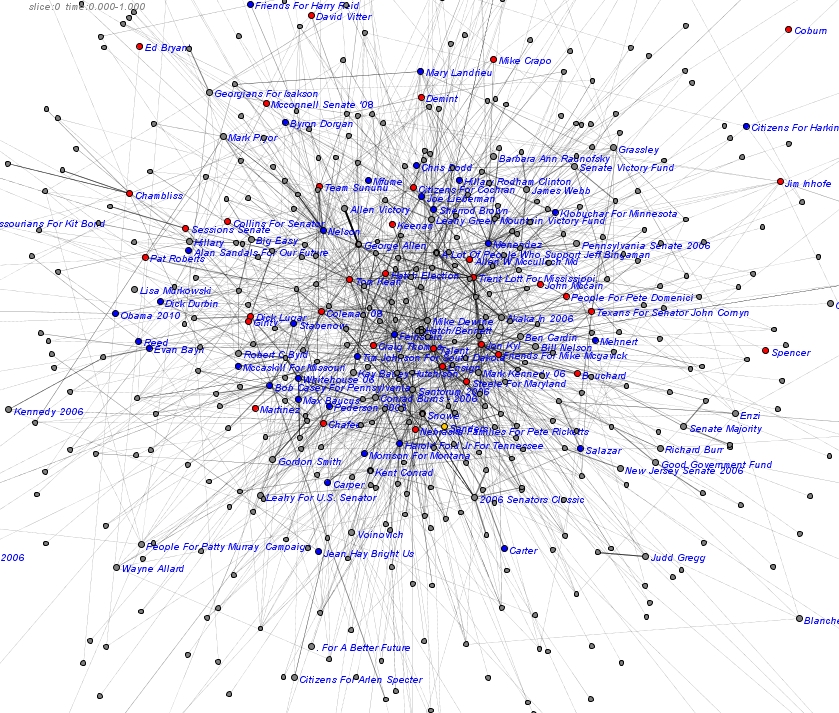
It is still very rough, but I’ve been having a very interesting time looking at contributions among PACs in FEC Data. This image shows transactions to Senate candidate’s central committes that were reported in May of 2006. Colors by party, grey is unkown / unspecified. Labels are on candidate’s committes, but some are violently truncated. Names of PACs have been removed to protect the guilty (actually because they are too long and make the graph cluttered)
They layouts are not converging very well, so the structure is not that accurate. This is also only showing one month’s data, so not very representative. But need much more specific queries and good aggregation rules to deal with longer time periods. Easy to imagine making it interactive, zoomable, animating the time data, adding to SNA metrics, etc. A long ways to go to build software to do this, but I’m excited to have something to show!

 The National Institute on Money in State Politics now provides a service where users can submit queries and download data in xml format. The documentation for the service (which requires setting up an account login) is here.