Josh Tauber (the guy behind GovTrack) recently wrote a book on Open Government Data. I think the chapter where he walks through the process of scraping and building a visualization is great, this kind of thing should be required reading for all non-coders who are interested in technology and transparency issues. It walks through really practical examples of why formats matter. Also liked the figure on the right for locating the strengths of various types of data formats with respect to intended use. Makes the great point that a “high-quality” electronic document isn’t always better for some purposes. Continue reading Open Government Data→
This is a catchall post to collect together a number of interesting network images I’ve run across in the last few years. The common feature is that they are all networks that are based in or arise from geography or spatial processes. Unlike most of the networks we often have to work with, these are mostly “planar” (or nearly so) meaning that they can usually be drawn in two dimensions with minimal crossing and distortion.
The six 1-square mile samples of urban patterns (above) and their primal graphs (below): 1. Ahmedabad; 2. Barcelona; 3. San Francisco; 4. Venezia; 5. Wien; 6. Walnut Creek. Cities are so diverse that, at a first sight, it seems hard to imagine that they share any common — though hidden — pattern, which is what they actually do.
Inspired in part by recent work for a client, I finally got around to pulling a long night to play with some Form 13F data from the SEC. This pdf image shows significant ownership relations for J. P. Morgan at the end of 2010. Or at least I think it does. I’d love to hear from anyone who knows more about these types of financial filings. Continue reading Adventures with J. P. Morgan and Form 13F→
I recently installed Mozilla’s Collusion add-on for Firefox. It maps out the set of information-sharing relationships between sites as you visit them and they install various 3rd-party-cookies to track your browsing history. Has a neat interactive network viz as a browser plugin where so you can highlight sites you’ve visit and who they reported to.
This image was after a week of low-intensity computer use. Not that surprising to see Google, Facebook and Twitter as very central nodes, tho still impressive to have an image of how many sites report to them. Some sites like quantserve.com I’d at least heard of before, but not some of the other central stats players like 2o7.net or media6degrees.com or imrworldwide.com that appeared lurking in the network.
The visualization seems to be built in SVG using the D3 library’s network code. The interactivity and design are quite lovely, at least for small networks. However, now that I’ve been running Collusion for a month, the graph is quite large and the animation is getting painfully slow and eating my CPU.
The folks at the New York Times continue to produce awesome data visualisations for their stories. Recently they’ve been splitting production to produce both print (above) and online interactive versions (below) of their figures. This is great, because it makes it possible to design for the strengths and weaknesses of each medium. The interactive version of the the Overview of the Euro Debt Crises viz is also really nice because the the column on the left allows selective hi-lighting of different elments of the network corresponding to various parts of the narrative. And its all in SVG! (via Ronald Rice)
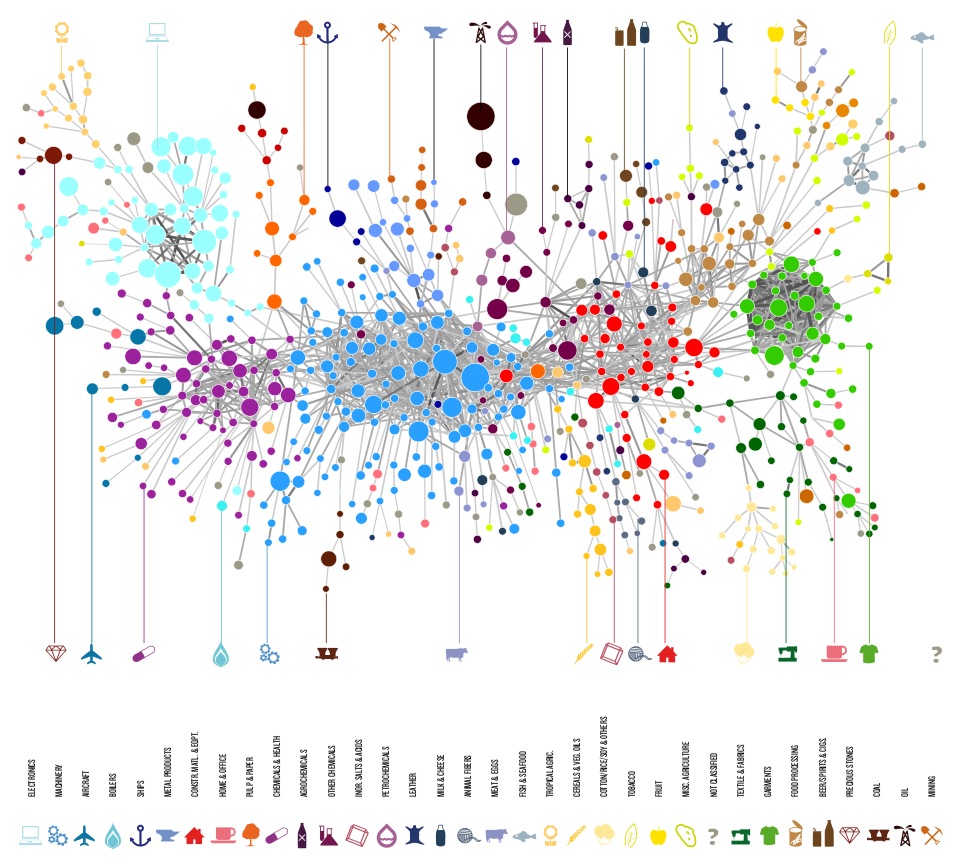
I just saw this lovely network map of the “product space” of exports (Atlas of Economic Complexity, via Infosthetics). The idea is to reveal what types of products are related to each other in the sense that there are common economic competencies need to produce them.
I’ve created a page to compare various tools for embedding a network diagram on the web. I used a small example set of researchers’ keyword associations. As always, browser compatibility is a big challenge. Most of the options I tested required a fair amount of web coding ability to get them working. I’d love to hear about other tools and ideas I may have missed.
I just spent some time comparing various tools for publishing web visualizations of region-coded data. I looked at some Google tools, ManyEyes, and Tableau Public. This is what I learned using my demo example. Please let me know of any other tools I should test…
Guess who is pumping in the money to support CA Proposition 23 to roll back California’s global warming legislation?
Yup, mostly its the companies that would be regulated when the law goes into effect. I’ve been working for the past few weeks to build prop23.dirtyenergymoney.com, an interactive network chart of the funding flows. Its an adaptation of our previous dirty energy money site, but using campaign finance data from California, and from OpenSecrets.org for the Federal PACs that are contributing in California. I think it is interesting to see the multiple layers, how the various group funnel in money and influence. I hope to be able to do an expanded version which would also show some of the other strings that Koch is pulling, why Chevron isn’t investing in Prop 23 (it seems they are backing 25 & 26 instead), and the the backers of the various No on 23 campaigns.
Also, can anyone help me figure out what happened to the $5000 contribution from Western Petroleum Marketer’s Association? It was in an earlier version of the data, but now seems to be missing from the filings. It seems that Tesoro may have solicited support for Prop 23 in their meetings, and I’d like to be able to include them.
Update: We’ve added panning and zooming features on the graph. We’ve also done a second chart for CA Proposition 26: prop26.dirtyenergymoney.com

 Josh Tauber (the guy behind GovTrack) recently wrote a book on Open Government Data. I think the chapter where he walks through the process of scraping and building a visualization is great, this kind of thing should be required reading for all non-coders who are interested in technology and transparency issues. It walks through really practical examples of why formats matter. Also liked the figure on the right for locating the strengths of various types of data formats with respect to intended use. Makes the great point that a “high-quality” electronic document isn’t always better for some purposes.


