California Funding Network Preview
These images were created as a quick cut-and-paste hack of California political contribution data available from MAPLight.org. The data is from 2003, representing only the 2003 election cycle, and is was originally sourced from the Institute on Money in Sate Politics. (Actually, it would have been easier to use their site directly if I'd noticed that is where the data was from, and they have data for multiple years, so this could be done as an animation in SoNIA ) I only took data from politicians A through B, 'cause I got tired of pasting, and it would be better with direct access to the DB.
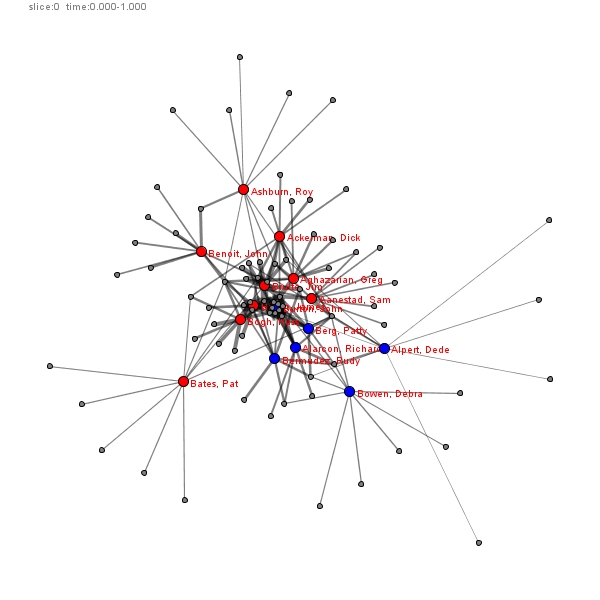
Technically, this is a bipartate graph of links between politicians and their top 10 contributors. Party of politician is indicated by color. Mouse over the contributers to read the label. Width of edges corresponds to amount of contribution.
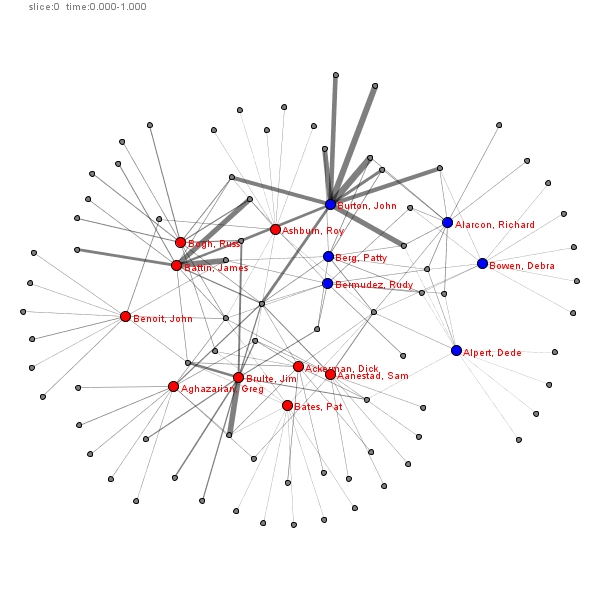
In the second image the positioning algorithm (KK) used the contribution amounts as weights. So the closer nodes are, the more they gave to the candidate. John Burton is absolutely buried in money!
Again, this is a rough hack using just a few of the candidates to test the concept, so no real conclusions should be drawn...
-skye (skyeome.net)