We are releasing an update to the R ndtv package for doing temporal visualizations of dynamic networks. The biggest new feature in this release is the ability to render networks as interactive SVG animations in a web browser with a single command via the ndtv-d3 javascript library (authored by Greg Michalec and myself for statnet) .
By default you can
- play forwards and backwards, jump to any point in the timeline
- zoom (mousewheel or pinch)
- pan (drag)
- display tooltips (click on a vertex or edge)
- highlight connections (double-click a vertex)
- change the playback speed (menu in upper right)
The example above can be produced in your local web browser with the R code below:
library(ndtv)

data(short.stergm.sim)

render.d3movie(short.stergm.sim)
Much of it is customizable. If you want to get under the hood, I’ve created a short vignette for ndtv-d3 with additional details on how to configure the the network plot (it generally follows the conventions of plot.network and render.animation) and how to include the results rmarkdown documents or export for embedding in a blog post like this one.
There are a number of updates and improvements elsewhere in the package. For example, the proximity.timeline function can now color by vertex attributes.
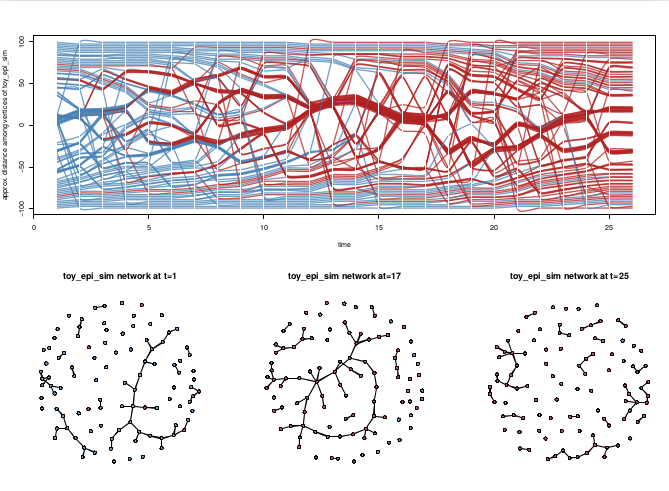
This image shows a trivial simulated epidemic process on a dynamic network produced by EpiModel. Horizontal splines correspond to the vertices of the network, with red color indicating infection status. The vertical positions are adjust to place closely-connected vertices in proximity, so you can see how the components group and break apart over time. The network snapshots below the timeline illustrate three time points for comparison. See the package vignette for example code.

If you will be at the 2015 INSNA conference, we will be doing a workshop session on Tuesday June 23 with in-depth tutorials of the package.
