
Network visualization
How can we present high-dimensional relational data in visual forms that allow us to make accurate intuitive assessments? I’m especially interested in techniques for visualizing networks that change over time (dynamic networks) and have written software and papers on the topic.
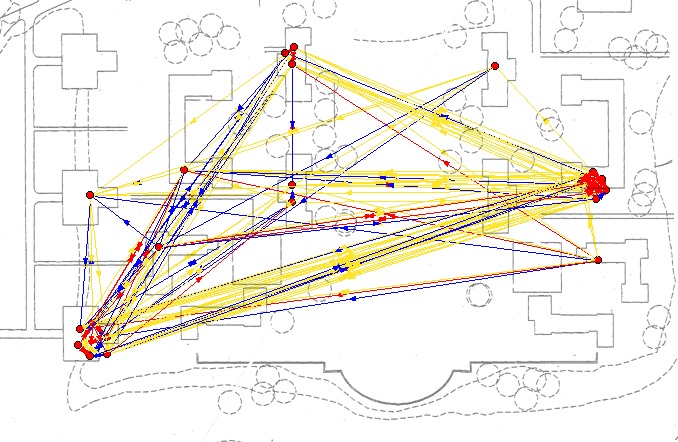
Spatial representation of the Wave 3 connections in the 22 network superimposed on a map of the Bennington campus. Nodes are position according to the geographical coordinates of their residence.
Transparency
How can we use our tech tools and toys to better understand the government, corporate, and social power structures that are all around us? If we unearth the information, can we act on it to reduce some of the massive imbalances of power?

Illustration of the process of extracting relationships from FEC campaign finance forms. From the dirtyenergymoney.com site.
Cultural transmission
How do ideas, habits, tools, attitudes, values and gossip move through groups of people? Are there patterns or regularities in what sticks and what doesn’t? How do social contact structures promote or inhibit certain kinds of transmission?
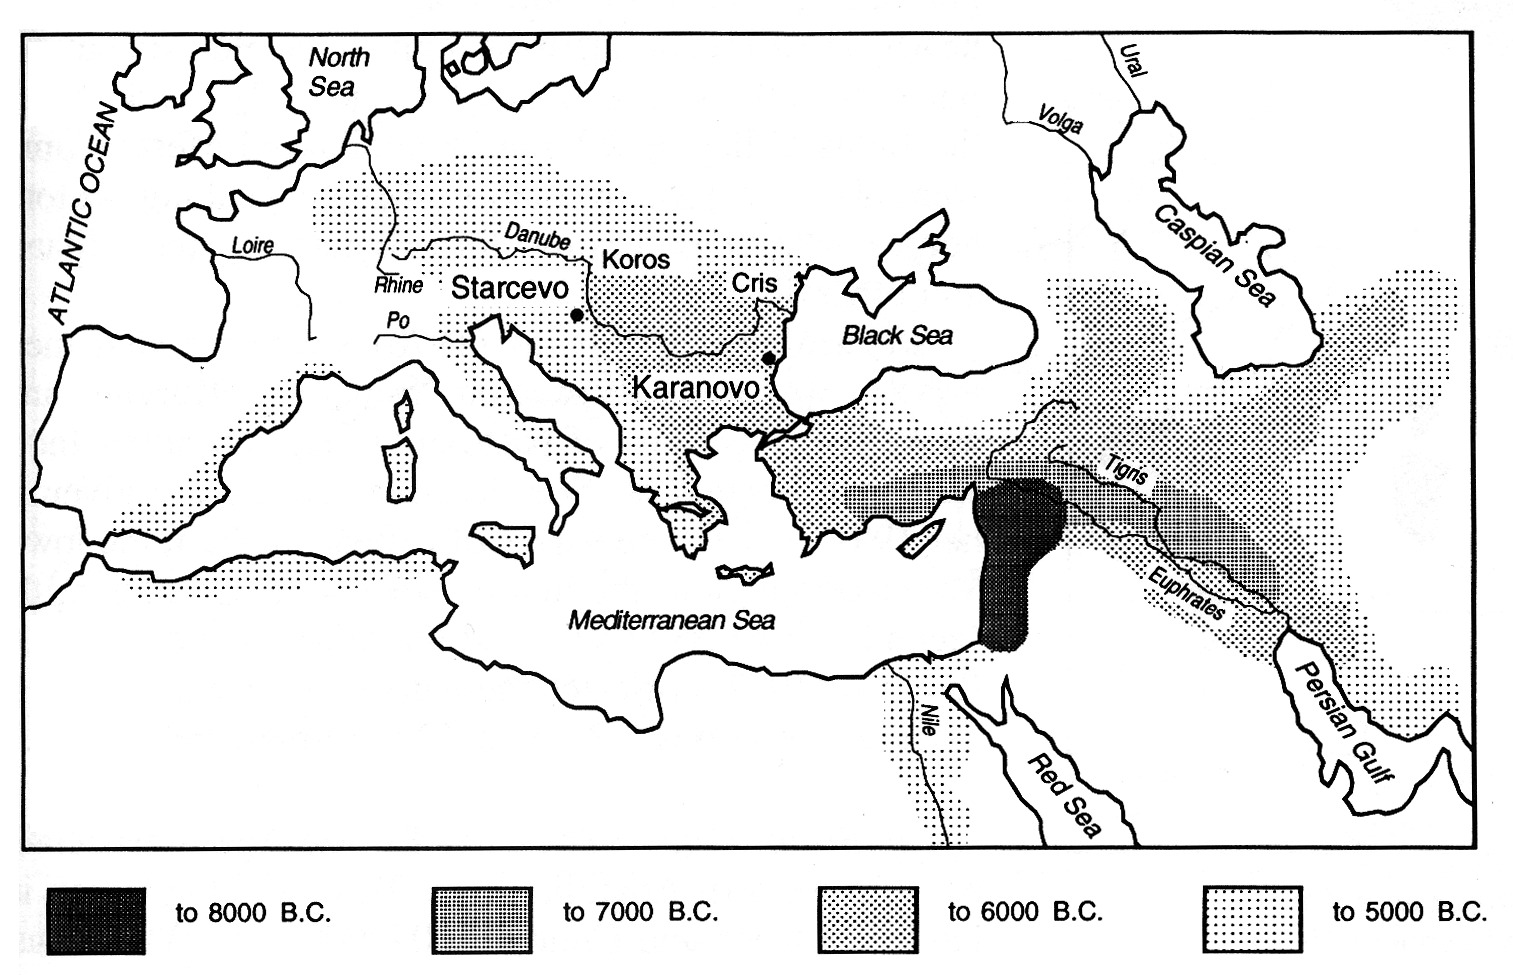
Map of the spread of Neolithic farming cultures from the Fertile Crescent. Shading indicates presence of archeological indicators associated with agriculture for given time period. (copied without permission from Cavalli-Sforza, Menozzi, and Piazza 1994 p. 257)
Data mining
How can we build tools to clean, match, mush, squish, scrape, aggregate and disambiguate from its many messy forms into well-structured usable information?