A long while back, Jimi Adams sent me a link to his 2017 paper with David Schaefer
Visualizing Stochastic Actor-based Model Microsteps which uses the ndtv package to illustrate the modeling process used by the RSiena tools.
(interactive animation | YouTube version)
The model is an Agent Based Model that estimates a plausible transition sequence as a series of ‘microsteps’ between the two observed timesteps at the beginning and end.
The node with an opportunity to make a decision is highlighted in red, and clicking it provides information about what choice they make. Node size is proportional to smoking level. Newly forming ties momentarily flash as green, dissolving ties as red. Pressing play allows the visualization to present the entire sequence of microsteps.
Ran into this on a friend’s bookshelf a while back. Great advice. I think that
“Thou shalt not spread false information. Thou shalt not pervert information to enhance profit or status.”
and
“Do not exchange your best understanding of how things work for cheap social consensus.”
are particularly relevant guidelines for people working in information design. Should there be a Hippocratic Oath for data visualization? :-)
Continue reading Thou shalt not spread false information →
Quite fittingly, a friend shared an article with interesting network images showing the extremely divided semantic and social spaces with respect to the war on Gaza.
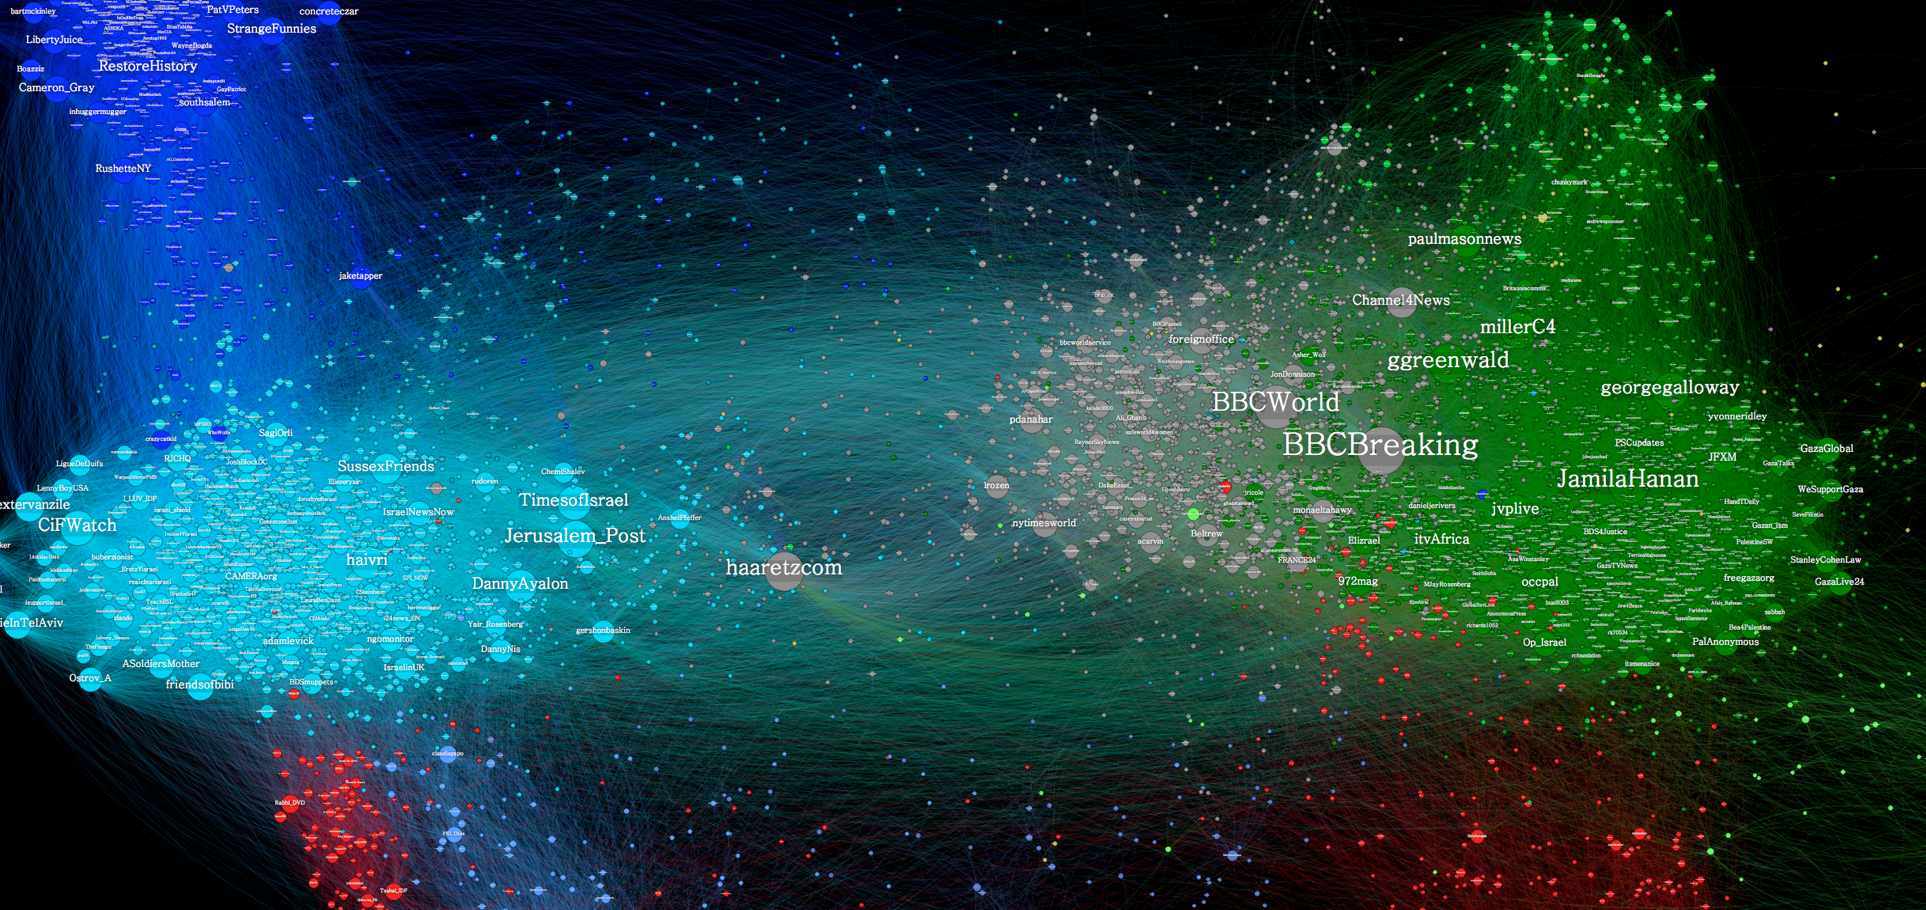
The network images in the article were apparently constructed from Facebook, Instagram, and Twitter data. Many of the images look like they were made with Gephi, but unfortunately the author doesn’t give sources for them.
While I think much of the semantic separation and “micro-propaganda” discussed in the article pre-dates social media, it is good to remember that our perception of events is increasingly filtered through our network of friends and amplified by story selection algorithms controlled by others. And it is perhaps comforting to see in these images some explanation for why otherwise seemingly sensible people can hold such shockingly different viewpoints: we are likely building our understanding of events from completely different sets of “facts” and narratives.
From the making the intangible tangible dept. Some nice work from CarbonVisuals. I’m not usually that excited about 3D geo rendering stuff, but this is elegant, simple, and compelling.
A single hour of NYC carbon emissions:
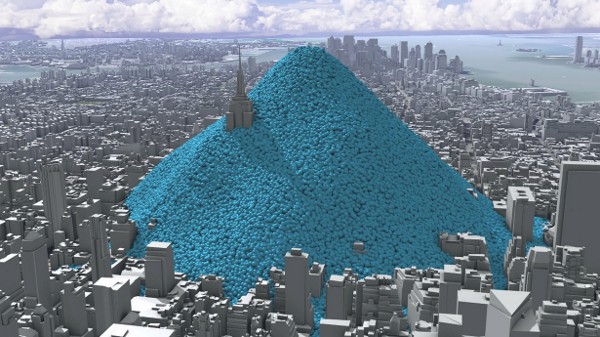
Carbon emissions associated with NYC public buildings:

broken link :-(
I think I need this one attached to my car keys. One Gallon of Gas:
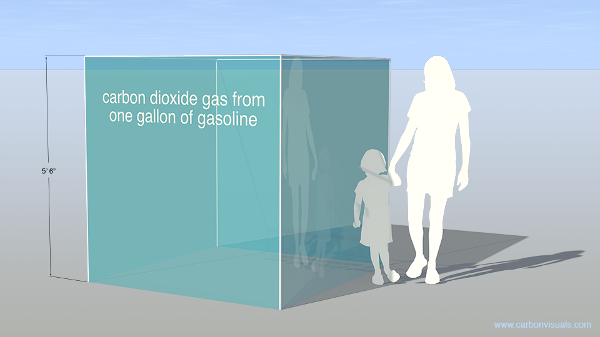
From the methodology document:
Take a typical room 20 feet x 20 feet x 9 feet. Only 400 parts per million of the air in the room is carbon dioxide, which doesn’t sound like a lot. However, that is nearly 11 US gallons of carbon dioxide, which sounds a lot more significant. 3.2 US gallons of that came from burning fossil fuels. If you show people that in every small room there is 3 US gallons of greenhouse gas that we have put there if begins to seem like a big deal.
I’m thinking maybe I should label three empty milk jugs and leave ’em in my living room to trip over, just so I don’t forget.
via infosthetics
curiosities of culture, communication & networks
