Category Archives: tools

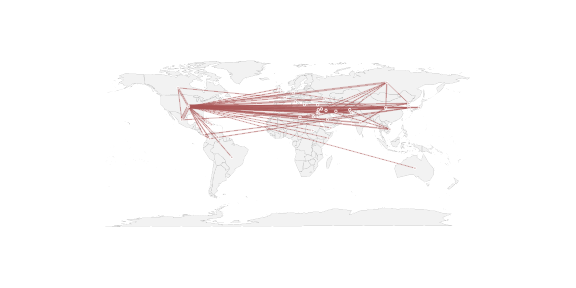
Network-on-a-map in R

A conversation on the SOCNET mailing list made me think that it might be worth writing up a quick illustration of how to do this in R with the network library. There are a 3 steps to a really basic geographic network plot:

  • Get relational data with appropriate lat and long coordinates for vertices (the hard step!)
  • Tell one of the R mapping libraries to plot a map
  • Tell the network library to plot the network with the lat & long coordinates, without first erasing the map

Continue reading Network-on-a-map in R

ndtv Demo Video & Workshop

Video Demo

I’m experimenting with using a screencast as a way to give tutorials and publicize new features we release as part of the statnet packages. As my first attempt, here is a quick YouTube intro / demo to some of the key features in the ndtv (Network Dynamic Temporal Visualization) package

If you find this format useful, please let me know and maybe I’ll do videos for the full tutorial with more technical explanations. Its definitely a good challenge to talk about things to imaginary people :-)

Workshop

I’m going to be giving an (obviously much longer) workshop on the ndtv, networkDynamic and tsna packages at the 2016 INSNA ‘Sunbelt’ social networks conference in Newport Beach (Los Angeles) California

Managing Dynamic Network Data in statnet:
Animations, Data Structures and Temporal SNA

Session Time: Tuesday April 5th, 3:00pm-6:00pm
Workshop Program

new ndtv release: 0.7

..and continuing in the thread of long-overdue R package updates, we’ve got a new ndtv version out as well.

Peek into the time prism

The package release adds some “whiteboard candy”: 2.5D orthogonal projection of networks in time along a z axis. For lack of a better name, I’ve dubbed it a timePrism (let me know if you find a pre- existing better name). Think of viewing all of the slices from a filmstrip from an angle. Probably hard to follow for large networks (or lots of time slices) but nice for illustrating concepts in temporal networks when you want to convey time and structure and can accept some loss of detail. Especially with the ability to include splines connecting specific vertices for highlighting trajectories.


library(ndtv)
data(toy_epi_sim)  
timePrism(toy_epi_sim,
           orientation=c('z','y','x'), # swap axes
           angle=40,
           spline.v=c(7, 29, 36, 70, 82, 96),  # hilite the infected 
           spline.col='red',
           spline.lwd=2,
           box=FALSE,
           planes=TRUE,  # draw a semi-transparent 'plane' under each net
           vertex.col='ndtvcol'  # use pre-created infection color scheme)
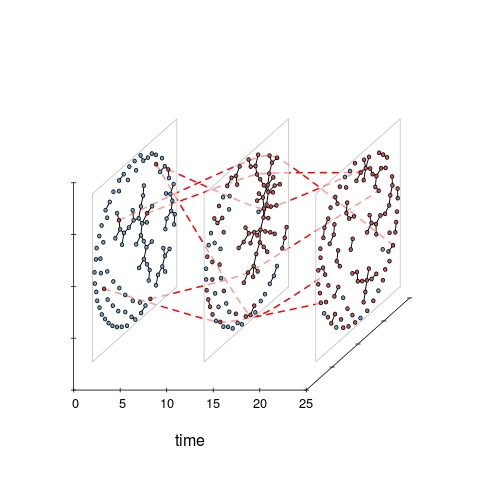
timePrism
Continue reading new ndtv release: 0.7

tsna : Tools for Temporal Social Network Analysis

We finally got the alpha release of the new tsna package up on CRAN! The goal is for the package to be a repository of algorithms and techniques for doing Social Network Analysis on longitudinal networks stored as networkDynamic objects. It includes:

The package vignette has lots more details.

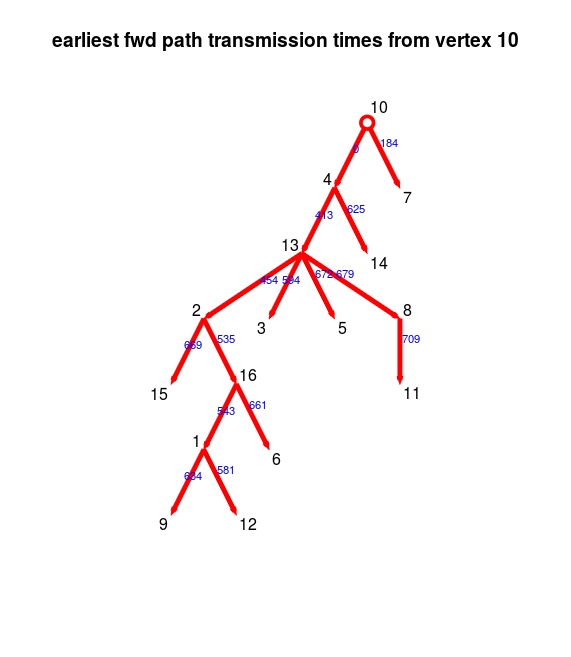
As a quick example, the code below extracts a forward temporal path (think “what is the earliest journey a message could take from vertex 10 to each vertex in the network while respecting edge timing”) and plots it as a transmission tree, including the transmission time for each edge:


# load the libraries
library(tsna)
library(ndtv)
# load a dynamic network example
data("moodyContactSim")
# compute the forward temporal path from vertex 10 at time 0
v10path< -tPath(moodyContactSim,10)
# plotting trees still a little complicated, 
# but with Graphviz and ndtv we can do it
plot(v10path,
    coord=network.layout.animate.Graphviz(as.network(v10path),
          layout.par = list(gv.engine='dot')),
    edge.label.col='blue',
    main='earliest fwd path transmission times from vertex 10')

v10_fwd_path

Create in-browser interactive network animations from R with ndtv 0.6.1!

We are releasing an update to the R ndtv package for doing temporal visualizations of dynamic networks. The biggest new feature in this release is the ability to render networks as interactive SVG animations in a web browser with a single command via the ndtv-d3 javascript library (authored by Greg Michalec and myself for statnet) .

By default you can

  • play forwards and backwards, jump to any point in the timeline
  • zoom (mousewheel or pinch)
  • pan (drag)
  • display tooltips (click on a vertex or edge)
  • highlight connections (double-click a vertex)
  • change the playback speed (menu in upper right)

The example above can be produced in your local web browser with the R code below:

library(ndtv)
data(short.stergm.sim)
render.d3movie(short.stergm.sim)

Much of it is customizable. If you want to get under the hood, I’ve created a short vignette for ndtv-d3 with additional details on how to configure the the network plot (it generally follows the conventions of plot.network and render.animation) and how to include the results rmarkdown documents or export for embedding in a blog post like this one.

There are a number of updates and improvements elsewhere in the package. For example, the proximity.timeline function can now color by vertex attributes.

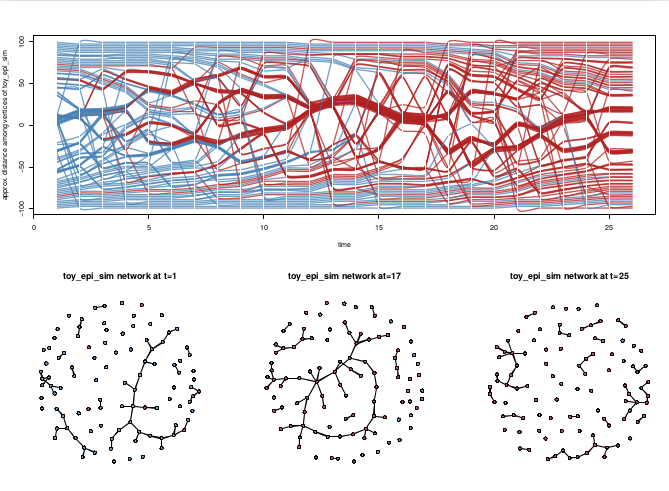
This image shows a trivial simulated epidemic process on a dynamic network produced by EpiModel. Horizontal splines correspond to the vertices of the network, with red color indicating infection status. The vertical positions are adjust to place closely-connected vertices in proximity, so you can see how the components group and break apart over time. The network snapshots below the timeline illustrate three time points for comparison. See the package vignette for example code.
proxTimeineWithInf

If you will be at the 2015 INSNA conference, we will be doing a workshop session on Tuesday June 23 with in-depth tutorials of the package.

Oligrapher from LittleSis

The folks at LittleSis (the opposite of Big Brother) have just released a nice tool for creating “powermaps” using the relationships between entities in their database. Powermaps are an informal term for a type of network graph illustrating various types of relationships between (often multiple types) of people or institutions

The maps are quite lovely, built as zoomable SVG objects embedded in the webpage with elegant highlighting and mouse-over label reveals. The entities on screen supporting clicking through to the corresponding page in the LittleSis database. From peeking at the Oiligrapher source code on github it appears that the tool makes heavy use of d3 (of course) and some of the force-directed network layout code. They cite Mark Lombardi as a strong influence for the visual aesthetic. Not sure about speed/performance issues on larger networks, but this seems like a great tool for these types of relatively sparse illustrations.

R package ndtv update + workshop + examples

Finally got the update to the R dynamic network visualization package ndtv 0.5.1 out the door and up on CRAN. This is part of the yearly flurry of statnet package releases (we also posted new versions of network, networkDynamic, ergm, etc, over the last week) in preparation for running workshops at the INSNA Sunbelt social network analysis conference. This year will be a first for me, we will be running a pre-conference ndtv workshop on 2/18/14, so I’ve been working to pull tutorial materials together.

One of the new experimental features in this release is a “proximity.timeline” function, a first stab at doing relationship timelines. The horizontal axis is simulation timesteps and the vertical dimension is geodesic proximity collapsed to 1D. Below is a proximity.timeline plot for the short.stergm.sim example object, showing a changing component with four isolates which eventually breaks into two components around time 20.
proximityTimeline
Continue reading R package ndtv update + workshop + examples

ndtv animation “live” at London Science Musuem

Dr. Michael White wrote to let me know about an exhibit / performance at a science museum that used a network animation produced with the ndtv package.

… we used QR codes and tablets to monitor the spread of an infectious disease throughout people attending the museum, and perform dynamic network visualizations in real time.

The article is a little vague about exactly how this worked, but it sounds like the visitors were given tokens to pass to each other, a few of which were labeled “infected”, and at various points they were scanned in by staff and the data used to update the animation of the transmission network? The animation is included in the article. Cool to see the software used in real life!