
Finally got the update to the R dynamic network visualization package ndtv 0.5.1 out the door and up on CRAN. This is part of the yearly flurry of statnet package releases (we also posted new versions of network, networkDynamic, ergm, etc, over the last week) in preparation for running workshops at the INSNA Sunbelt social network analysis conference. This year will be a first for me, we will be running a pre-conference ndtv workshop on 2/18/14, so I’ve been working to pull tutorial materials together.
One of the new experimental features in this release is a “proximity.timeline” function, a first stab at doing relationship timelines. The horizontal axis is simulation timesteps and the vertical dimension is geodesic proximity collapsed to 1D. Below is a proximity.timeline plot for the short.stergm.sim example object, showing a changing component with four isolates which eventually breaks into two components around time 20.

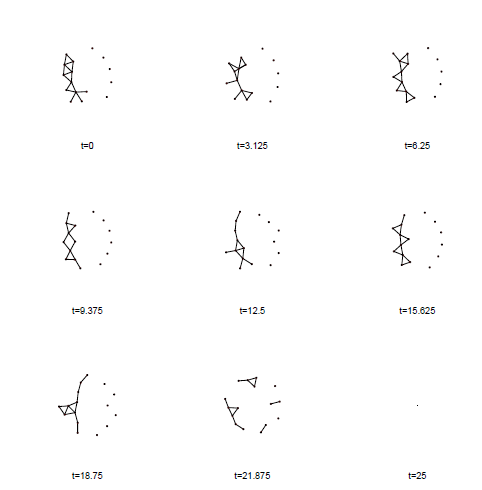
For comparison, here is a “filmstrip” (small multiple plot) version of the same network. You can see the same component split around 20.
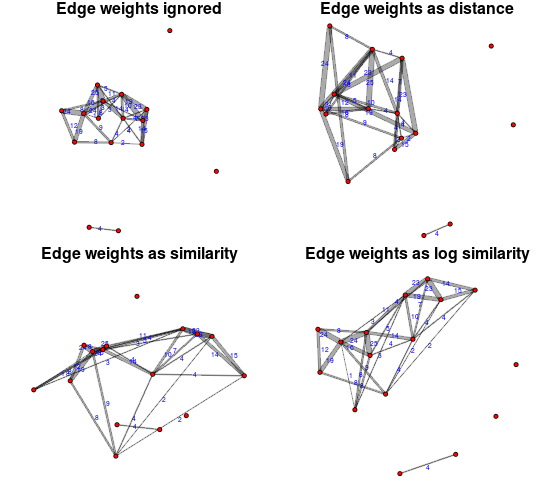
On a slightly different topic, this plot was generated as an example comparing the effects various ways of applying edge weights/durations from aggregating a network over time. The pure similarity and distance versions are a bit challenged because the range of weights is larger than the feasible range of plot distances. I think the logged version gives a nice balance–heavily weighted edges draw edges closer than lightweight edges, but not so much that the layout is squished and unreadable.
Here is a link to the current pdf of ndtv tutorial materials.