First, a confession: I never read Lord of the Flies. I remember thinking as a kid that it sounded scary and grim, and have yet to get around to reading it as an adult. But now I don’t have to because, thanks to Jimi Adams, I can watch a network animation of the the evolving social structure in the novel :-)
Jimi used the book in an undergrad SNA course as a way to illustrate network concepts and metrics, reporting the experience in a paper Using Lord of the Flies to Teach Social Networks. In the process he coded up all the conversations between characters in the novel (directed blue ties) — as well as their co-appearances in the same locations (undirected gray ties) — as a longitudinal network. The 473 time slices were then rendered as a video using the ndtv R package. The paper gives links to time points in the movie where the network structures can be used as examples of the concepts he discusses.
Jimi made the data available for download as a single R networkDynamic object at http://goo.gl/YWMSXQ. Encoded in the object are the durations accounting for node (dis-)appearances, durations for speaking and co-presence ties, as well as dynamic node attributes to indicate possession and transfer of the conch (the boys’ ceremonial ‘talking stick’, shown in green), and deaths. From correspondence, I’ve learned that the few red ties indicate violent conflict.
I was planning to post here an alternate temporal visualization using just one of the tie types, but realized that I’ll need to look at this in more detail in a future post. I had been thinking of this network as multiplex (with the potential for more than one edge active between a pair of vertices) but in fact tie types are coded as a dynamic ‘weight’ attribute with with discrete values for each type. This works fine for the movie but it means that tie types are mutually exclusive. Although pair of characters can’t be coded as simultaneously co-present and talking, as a work around we could probably infer the former from the latter since conversations are face to face. However the main issues is that, off the top of my head, I don’t have a method for extracting one dynamic network from another including edges as active only when an attribute is active with a certain value. Stay tuned ..
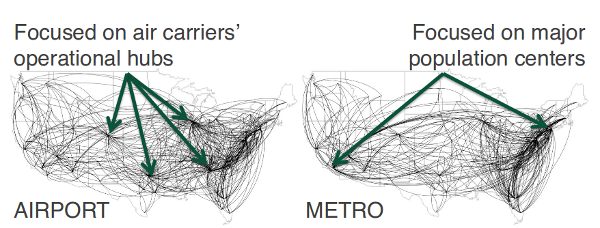
While trawling for interesting dynamic network datasets, I bumped into one about U.S. airport passenger traffic aggregated by Zachary Neal.. I lifted this image from his slides (p.9):
These data contain annual U.S. air traffic flow networks from 1993 to 2011. They were constructed from Bureau of Transportation Statistics’ Origin and Destination Surveys using the AIRNET program
What I thought was cool is that he constructs the network in two ways: one is the passenger flow between specific airports, the other is total passenger movement between metropolitan areas (if I’m reading his data correctly). He claims the first approach yields a hub-spoke network driven by airline hubs, while the second highlights travel between dense population areas. Both are derived from the same data. I think it shows how important it is to think carefully about how to construct networks that correspond well to the phenomena being studied. Are we interested in relative traffic between cities, or in the the actual flow of people (via roads, airports) between the cities? In hindsight, its obvious that these are very different networks (the first one for example should be nearly fully connected, right?).
I’m assuming that there is some thresholding going on in these images, ’cause the dataset he provides seems to have lots more edges in it.
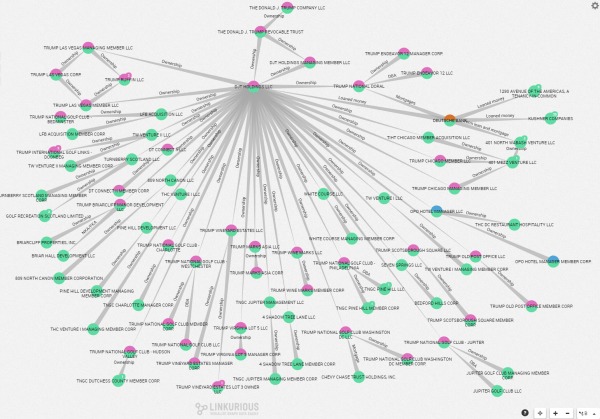
Inspired in part by recent work for a client, I finally got around to pulling a long night to play with some Form 13F data from the SEC. This pdf image shows significant ownership relations for J. P. Morgan at the end of 2010. Or at least I think it does. I’d love to hear from anyone who knows more about these types of financial filings. Continue reading Adventures with J. P. Morgan and Form 13F→
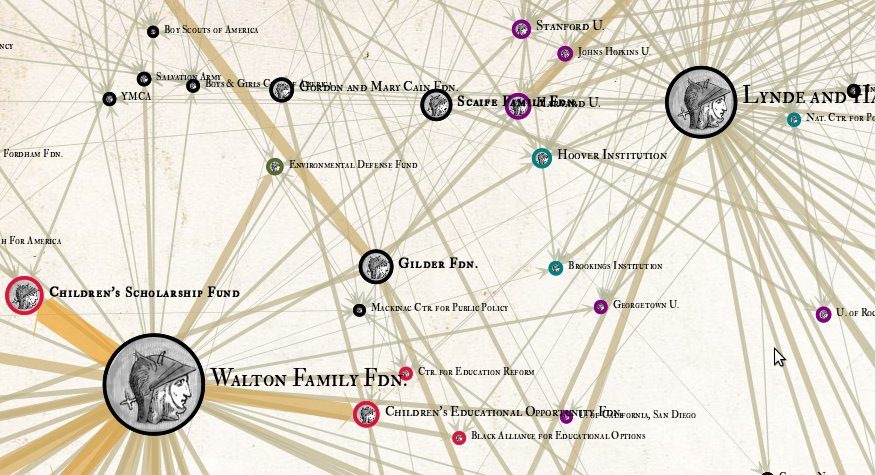
I’ve been working for the past several months to build AngelsOfTheRight.net a new interactive version of the conservative philanthropy network data from the Media Matters Conservative Transparency Project and other sources. The idea is to have an atlas where you can dive in, explore, and see which organisations have similar patterns of funding relationships. As always, my hope is to make some of these invisible economic and power relationships a bit more tangible. Continue reading Angels of the Right – version 2.0→
I’m interested in making political structures visible. Trying to put those half-realized connections and linkages into a tangible form–a map that we can point to. I recently located an online database of conservative funding relationships created by Media Matters Action Network. I was able to scrape the site and (with their permission) experiment with some network diagrams in pdf form to visualize the funding relationships among “angel investor” foundations and right-wing organizations. Continue reading Angels of the Right v1.0→
Found a well-structured dataset on Recovery Act contracts at fedspending.org. Created a network map for the Awards funded by Department of Defense (except military departments) category. Also serves as a crude user interface to the data. Clicking on contractor nodes links to full record with information about the contract.
Would love to build something like this for the whole dataset, or for the TARP funds.
Fedspending.org already does some flash-based geographic maps to show which states the money is (initially) ending up in.
(click for interactive version)
UPDATE Feb 11, 2010
When working with the this data, I was very surprised to see a name I recognized jump off the screen. Nehalem River Dredging is small 2-6 person operation with a single boat based in my home town. Could they really be receiving a $47,150,000 contract with the Army Corps? Almost 50 million dollars!? That probably greater than the entire yearly economic output of the town. Since this data is known to have some highly-politicized problems (like the flap about the non-existent congressional districts) it seems like there may be some kind of error. My father called up the Port wheer the dredging is being done to investigate. Sure enough, they said there is a two decimal place error in the reported contract amount. It was actually $470,150. So I guess the message is take this data (which is self reported by recipients as I understand it) with a grain of salt, there is plenty of room for two-orders-magnitude errors to sneak in.
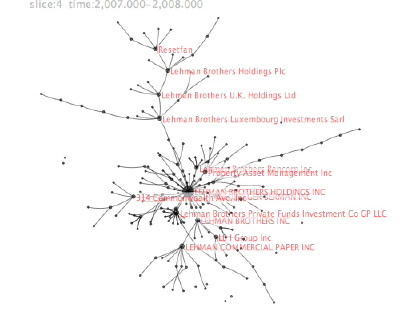
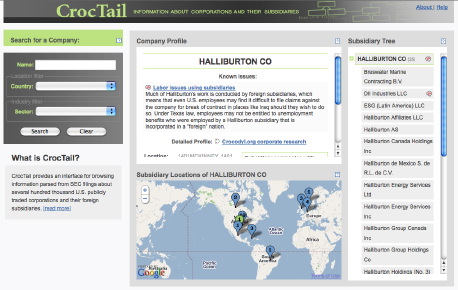
For the past several months, Greg and I have been working on project to scrape corporate subsidiary ownership relations from Securities Exchange Commission filings. The first part of the project launched today! So now you can pull down company names and relationships for more than 200,000 publicly traded U.S. corporations and their subsidiaries from http://api.corpwatch.org. If writing code is not your thing, we also built an interactive browser for the data at http://croctail.corpwatch.org.