
… from the perspective of its SEC filings
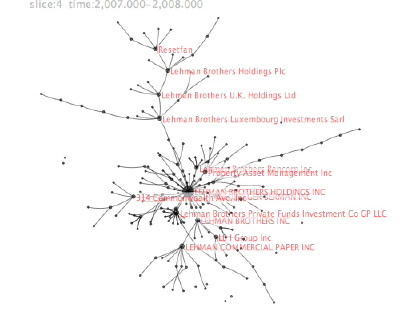
Click here for a movie of the changes in corporate structure at Lehman Brothers from 2003-2008. Each dot is a subsidiary corporation and each line is a declared ownership relation.
This is a sneak preview of the data we’ve been pulling together for the CorpWatch API project. We are getting ready to roll out a multi-year version of the data at the end of the month. We now have yearly snapshots of the subsidiary structures that corporations report to the SEC as part of the 10-K, Exhibit 21 filings. Now that we have the time data of course the first thing I wanted to do was run them through SoNIA to see how the ownership trees shift over time.
These three movies show the growth and change corporate structures — restricted of course to the data they reported, and subject to possible parsing errors.
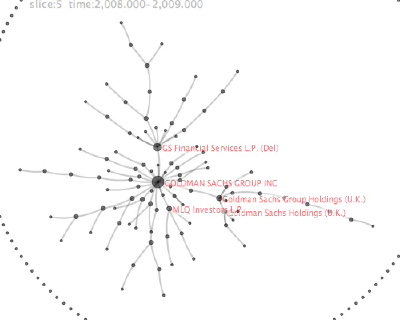
- Goldman Sachs movie The “ring” of nodes around the main network are companies with names that include “Goldman Sachs” but are not reported in the main filings. Since these must be associated in some way with Goldman Sachs, but we don’t have any ties for them, it kind of gives an idea of how many relationships we are “missing”– the Exhibit 21 filings are just the tip of the glacier, lots of other little icebergs floating around out there.
- Lehman movie does not have 2009 data (will they ever? ;-). When the 2009 data is complete, I wonder if we will be able to locate their sold-off divisions now belonging to other companies?
- Coca Cola movie. Started from a query looking for names like “Coca Cola”, so it includes the “Coca Cola Bottling” and “Coca cola Enterprises” divisions that are legally separate corporations even though they are controlled by the parent.
I think the animations give sort of a qualitative sense of how much the structures shift over time. These multinationals appear more as quickly morphing webs than stable monolithic entities. And you can almost watch them shuffle assets around. For example, in the Lehman movie it looks like “PROPERTY ASSET MANAGEMENT INC” is purchased by “LEHMAN ALI INC” in 2005 and then quickly passed on up to the core. Know any org theorists or financial analysts who can explain what is really going on here?
Hm.
Clarification question – each time the movie shows a new network, the nodes glide around for a just one second while edges don’t seem to change. What’s going on? Is this just a settling of the energies or something? It’s an artifact of the visualization, right? It doesn’t denote the passage of time, does it? The real data points are at each major transition between networks, right?
[I think this is might be a SONIA 101 series-of–questions]
The network is adjusting to a new “best layout” after the deletion and addition of edges. SoNIA is designed to work best with streams of relational events in continuous time so that the changes in the structure would usually denote the passage of time. But these corporate networks are discrete panel data, we only have a yearly snapshot of the network so the animation is just repositioning for the next layout.
[network viz geek note:]
I actually generated these movies by running the sequence of layouts in reverse, so that each new node appears in its best location in the subsequent slice. This makes the animation smoother but creates some weird artifacts in that the “new” relations shift less than the “old” relations. I think I’m gonna go back to the old way…