
A conversation on the SOCNET mailing list made me think that it might be worth writing up a quick illustration of how to do this in R with the network library. There are a 3 steps to a really basic geographic network plot:
- Get relational data with appropriate lat and long coordinates for vertices (the hard step!)
- Tell one of the R mapping libraries to plot a map
- Tell the network library to plot the network with the lat & long coordinates, without first erasing the map
First we load the libraries
library(network)  # basic 'statnet' network library
library(maps)     # basic R map plotting library
Usually the hardest part of working with geographic data is doing the “geocoding” to assign latitude and longitude to data points (vertices). For this example, we can grab a dataset, courtesy of Katherine Ognyanova, that has already been geocoded from http://kateto.net/countries This is a dataset of co-occurrences of country names in statements by U.S. Congressmembers.
The first file contains node-level data about all all of the countries, including the latitude and longitude data we will use
# download and parse CSV files
rawnodes<-read.csv('http://www.kateto.net/wordpress/wp-content/uploads/2015/06/Country_terms_FREQ.csv')
names(rawnodes) # print the column names
##  [1] "ID"        "Dem_freq"  "Rep_freq"  "Tot_freq"  "lat"
##  [6] "lon"       "Tot_freqn" "Dem_freqn" "Rep_freqn" "Dif_freq"
## [11] "Dif_freqn"
The second file contains the pairs of country-country names and information on the number of term co-occurrences. We will use this to create the edgelist.
rawedges<-read.csv('http://www.kateto.net/wordpress/wp-content/uploads/2015/06/Country_terms_COOC.csv')
names(rawedges) # print the column names
##  [1] "Source"    "Target"    "Dem_cooc"  "Rep_cooc"  "Tot_cooc"
##  [6] "Rep_coocn" "Dem_coocn" "Tot_coocn" "lat.to"    "lon.to"
## [11] "lat.from"  "lon.from"
nrow(rawedges) # how many edges are there?
## [1] 11789
Because there are a lot of edges in this network, if we plot the whole thing it will be visually unintelligible. So we can filter on the Tot_cooc variable to only include relationships between terms that have a total coo-occurrence of more than 500 times.
# subset to form a smaller matrix with only strong ties
reducedEdgelist<-rawedges[rawedges$Tot_cooc>500,c('Source','Target',"Tot_cooc")]
head(reducedEdgelist)
| Source | Target | Tot_cooc | |
|---|---|---|---|
| 40 | afghanistan | china | 940 |
| 55 | afghanistan | israel | 757 |
| 72 | afghanistan | pakistan | 2286 |
| 81 | afghanistan | libya | 763 |
| 82 | afghanistan | vietnam | 985 |
| 115 | afghanistan | russia | 610 |
nrow(reducedEdgelist)
## [1] 80
80 relationships seems a lot more workable, so lets convert the edgelist into a network, bringing along the total co-occurrence variable as an edge value attribute.
coocNet<-network(reducedEdgelist,
                 matrix.type='edgelist',
                 directed=FALSE,  # this will be an undirected network
                 ignore.eval=FALSE,  # confusingly, this tells it to include edge weights
                 names.eval='Tot_cooc'  # names for the edge weights
                 )
Because we reduced the set of relationships, we also reduced the set of vertices from the full list of countries. So we now need to match up the coordinates in the rawnodes file with the right vertices. For convince, we attach the lat and lon to the network as vertex attributes.
# attach the appropriate lat and long coordinates
# need to subset to the vertices actually in the network
coocNet%v%'lon'<-sapply(network.vertex.names(coocNet),function(name){
  rawnodes[rawnodes$ID==name,]$lon
})

coocNet%v%'lat'<-sapply(network.vertex.names(coocNet),function(name){
  rawnodes[rawnodes$ID==name,]$lat
})
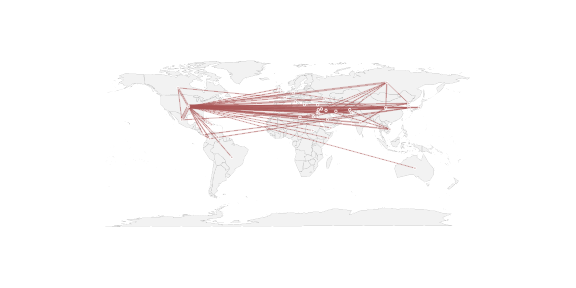
Now we can actually do the plotting of the world map with the map() command, followed by the plot.network() command. Note the the new=FALSE argument that tells it not to erase the map before drawing the network. The coordinates are passed in via the coord= argument as a two-column matrix.
# plot the map for the background
map('world',fill=TRUE,col='#f2f2f2',lwd=0.08)

# plot the network using the geo coordinates
plot.network(coocNet,  # pass in the network
             # don't erase the map before drawing the network
             new=FALSE,
             # get coordiantes from vertices and pass in as 2-col matrix
             coord=cbind(coocNet%v%'lon',coocNet%v%'lat'),
 # ---- all the rest of these are optional to make it look nice ------
             # set a semi-transparent edge color
             edge.col='#AA555555',
             # specifiy an edge width scaled as fraction of total co-occurence
             edge.lwd=coocNet%e%'Tot_cooc'/500,
             # set the vertex size
             vertex.cex=0.5,
             # set a semi transparent vertex color
             vertex.col='#AA555555',
             vertex.border='white',
             # please don't jitter the points around
             jitter=FALSE)

For this network we see that a lot of the ties involved the US. Not surprising, but may not be the most interesting feature of the data. So might be worthwhile to remove the USA vertex and lower the filtering threshold … but this post is supposed to be just about the mechanics of overlaying a network on a map.
However, it is often the case that geographic positioning of networks doesn't do a great job of revealing the network structure. The map is essentially providing geographic context and implicit labeling, but if the underlying data is not drivien by geographic proximity important details can be obscured. For this example, I think it would be more intepretable as traditional network diagram where vertex positions are determined by network proximity.
# but it is actually far more useful as a regular netowrk
plot.network(coocNet,displaylabels=TRUE,boxed.labels=TRUE,
             vertex.cex=0,
             label.pos=5,
             label.cex=0.6,
             edge.lwd=coocNet%e%'Tot_cooc'/500,
             edge.col='#AA555555',
             mode='kamadakawai')

Katherine Ognyanova also collected a number of posts on how to draw Great Circle curves on maps in R. These may help a little bit with edge overlap, but to use them you will need to roll-you-own network rendering code. This one is from Flowing Data: http://flowingdata.com/2011/05/11/how-to-map-connections-with-great-circles/ There are of course lots of cases where you might want to do more sophisticated things with map projections. But for a quick-and-dirty plot, network seems to do pretty well. Of course I'd love to do the animated version of this with the ntdv package, so please contact me if you know of an appropriate dynamic dataset with geographic coordinates.
P.S. I was able to write this in rmarkdown and have it post directly to the blog using the RWordPress package! http://yihui.name/knitr/demo/wordpress/
When I used the network function, R gave me an error message below. What is the problem??
———————-
coocNet<-network(reducedEdgelist,
+ matrix.type='edgelist',
+ directed=FALSE, # this will be an undirected network
+ ignore.eval=FALSE, # confusingly, this tells it to include edge weights
+ names.eval='Tot_cooc' # names for the edge weights
+ )
Error in .Call(setVertexAttribute_R, x, attrname, value, v) :
NULL value passed as symbol address
It is hard to know what is going on without more context, have you tried posting to stack overflow or the statnet help mailing list? https://statnet.csde.washington.edu/statnet_users_group.shtml
This has been very helpful. I am, however, having some difficulty attempting to follow the same steps with my data. I have a network of 79 edges with 50 vertices. My network is a simple list of 79 rows (the edges) with two columns of one vertex (first column) connected to the second vertex (second column).
Along with that, I also have an attribute table that contains the longitude and latitude of each vertex.
I am now trying out this portion of your code: plot.network(coocNet, new=FALSE, coord=cbind(coocNet%v%’lon’,coocNet%v%’lat’))
I am a little lost with this part: coord=cbind(coocNet%v%’lon’,coocNet%v%’lat’).
How would I apply this with my data? Again, I have two tables, one containing the edgelist and the other containing the attributes, including the longitude and latitude of each vertex.
Thanks.
Can’t find the network library.
> library(network)
Error in library(network) : there is no package called ‘network’