
.. and includes a network movie of a disease transmission processes that I worked on.
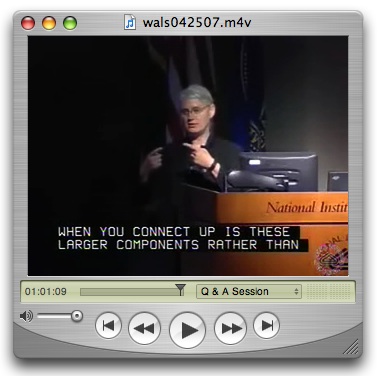
Much of the work at the University of Washington CSDE Network Modeling project is done with a very distributed team. But this collaboration took it to a new level. It was a very strange thing to be up late at night in my room in San Francisco, putting the finishing touches on the rendering of a model of disease transmission in a dynamic network, corresponding with Duke, UW in Seattle, and a motel room in DC. Wake up in the morning in time to watch live streaming video of Dr. Morris at the podium delivering an excellent presentation. I’m trying to remain cynical about modern communications tech, but it was pretty impressive. (admittedly, my bandwidth was a little low, so I had to keep restarting RealPlayer every 3 minutes, kind of a pain)
From the talk abstract:
Local Acts, Global Consequences: Networks and the Spread of HIV
For HIV and other sexually transmitted infections (STI), the potential for epidemic spread depends on connectivity in the underlying sexual network. Since most people have few partners, traditional STI theory and prevention strategies have focused on the role of “core groups” and “superspreaders” in establishing the connectivity needed to sustain transmission. This has been a successful approach for curable STI in low prevalence settings, but is not as effective in explaining or intervening in a generalized epidemic, as HIV has become in many sub-Saharan African countries. In this context, transmission is well established in the broad group of less active persons. We show how network connectivity can emerge in such networks, with the central role played by concurrent partnerships-partnerships that overlap in time – rather than high rates of partner change. …
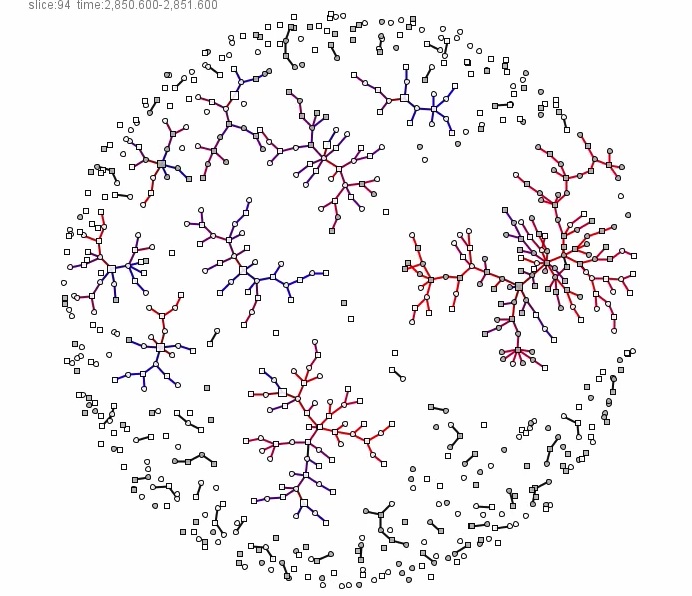 The presentation is a little over an hour long, and is available as a podcast/quicktime from the NIH. She shows the quicktime movie of the transmission processes at the end of the lecture. It was done in SoNIA, using the rSonia link and dynamicnetwork package for R we’ve been building. The model of network dynamics was constructed by the CSDE team from real ego-centric survey data using the development version of the statnet package for Exponential Random Graph (ERGM) modeling (Handcock, Morris, Hunter, Goodreau, et . al) the network package for R (Carter Butts, and many of the same people). Ten simulated infections were percolated through the network of 10,000 nodes using code by Susan Cassels, Steven Goodreau. James Moody and I massaged the output in various ways to build the viz.
The colors of the edges indicate the relative number of concurrent (red) vs. monogamous (blue) transmissions along the infection path. We leave all the infecting ties in viz in order to show the growth of the transmission path. At the very end, the visualization transforms to an infection tree view with generation time as the vertical axis.
2 thoughts on “Local Acts, Global Consequence: Dr. Martina Morris presents to the NIH”