
The ndtv package is finally up on CRAN! Here is a the output of a toy “tergm” simulation of edge dynamics, rendered as an animated GIF:
[link to movie version a basic tergm simulation]
For the past year or so I’ve been doing increasing amounts of work building R packages as part of the statnet team. The statnet project is focused on releasing tools for doing statistical analysis on networks (Exponential Random Graph Models “ERGMs”) but also includes some lower-level packages for efficiently working with network data in R, including dynamic network data (the networkDynamic package). One of my main responsibilities is to implement some network animation techniques in an R package to make it easy to generate movies of various types of simulation output. That package is named “ndtv“, and we finally got it released on CRAN (the main archive of R packages) a few days ago.
The goal is that once you’ve got your network data loaded into a networkDynamic object, you should be able to view it as a movie with a simple command like render.animation(myMovie). In reality, telling it exactly what you want to see can be a little bit more complicated, but the darn thing seems to work! Here is the networkDynamic package vignette if you want to walk through some examples. It does include some SoNIA-like capabilities for specifying time windows and streaming events, but currently works best on discrete data.
We also recently released updates to the networkDynamic package which make some of the ndtv stuff possible. The biggest new feature is the addition of structures and functions for working with dynamic attribute data of nodes and edges. There is a fairly detailed package vignette illustrating the main capabilities.
And for a navel-gazing example, here is a movie I hacked together of the statnet team’s svn code commits to the networkDynamic package to date:
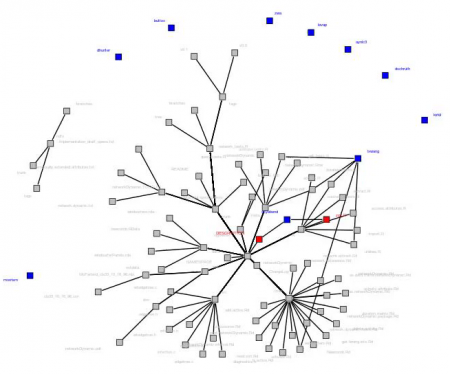
Time is in commit numbers, gray vertices are the file system tree for the package, people are in blue. They are connected to files when they make edits. Files are supposed to turn red when created or edited, but there are still some bugs in my import script. The code parses the history of commits from the XML output of the ‘svn log’ command into a networkDynamic object, and then runs that through ndtv to make an animation of people editing files.
This version of the movie kind of under-represents Carter Butts’s contributions. Basically the package sprung forth fully formed from his forehead, but then nothing happens for a very long time because development was taking place on other packages. So I cut out the boring part at the beginning of the movie.
One thought on “ndtv: network dynamic temporal visualization”