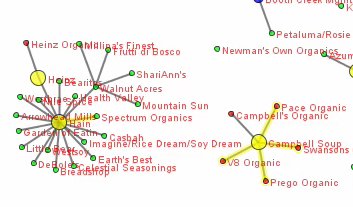
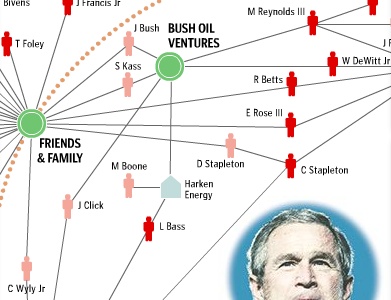
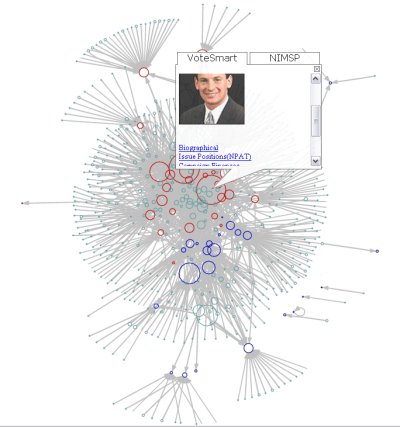
This document outlined some of the problems we ran into while building the Follow the Oil Money contribution network mapping application. It was written in November 2007, partially as a proposal, so many things changed in the real version. Also, most of the links are dead, as they pointed to an internal server. More info here.
An Interactive Web Application for viewing Oil Industry Contribution Network Data
Report to Oil Change International by Skye Bender-deMoll and Greg Michalec
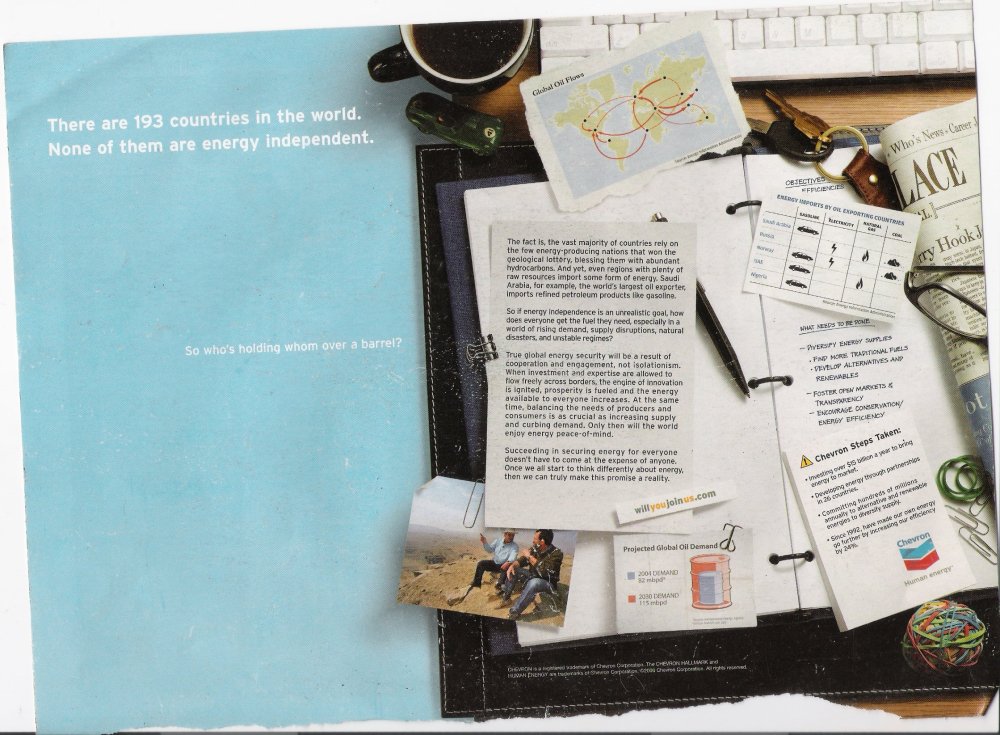
I found an interesting Chevron advertisement inside the back cover of the July 2007 issue of Harper’s magazine. Captioned “There are 193 countries in the world. None of them are energy independent.” it depicts an open notebook with clippings of a number of graphics and charts showing information about energy interdependence. Continue reading Oil Networks, Advertising, Imaginary Data?→
The story (that heavy people have heavy social contacts) has been all over the media and showed up in the Health section of the Paper of Record. Find Yourself Packing It On? Blame Friends
[original in high quality .mov format w/o voice over]
It is a good nudge to me to get the newer version of SoNIA released. One criticism I have of the animation is that the multiple components of the network are overlapping, making it difficult to see the structure well. Some of the newer features funded by the CSDE help with this, but at the cost of a much longer running time to compute the movie.
This month Berkley-based non-profit MAPLight.org expanded their coverage of the relationships between interest groups, legislators and votes to include data for US Congress.
MAPLight.org for Congress combines all campaign contributions to U.S. legislators with legislators’ votes on every bill, using official records from the Library of Congress web site and the nonpartisan Center for Responsive Politics (OpenSecrets.org). The resulting database of bills, voting records, and campaign contributions powers the search engine at MAPLight.org and enables people to see the links between dollars spent and votes cast in Washington D.C. [maplight press release]
Maplight is doing some serious legwork to augment the CRP data with industry positions on bills. They are also doing neat things with timelines so that the user can get a better idea of the relations between donations and key votes.
I’ve been thinking for a while about using a methodology called Principal Component Analysis (PCA) to create visual comparisons between various political candidates. Finally stole a few minutes to give it a shot using industry sector contributions to the current presidential races.
This was done as an entry in the Sunlight Foundations Mashup Contest. Cross your fingers that we win and get some resources to continue the project! ;-) Continue reading Unfluence Project Launched!→