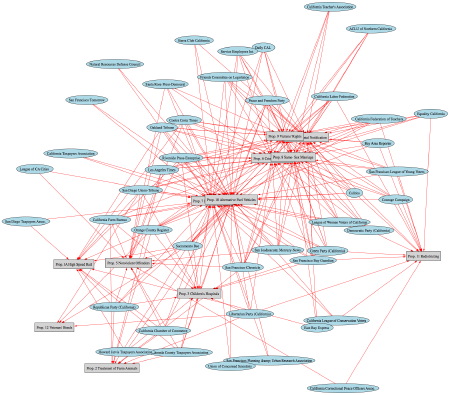
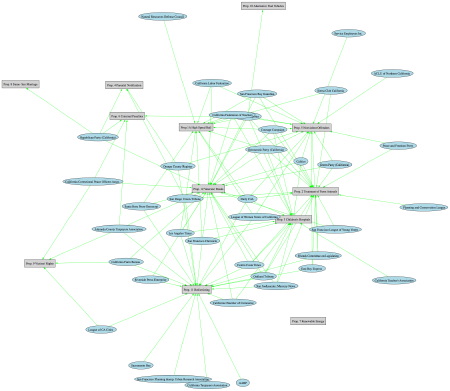
It is election day! Fingers crossed…. ;-) Before today I was searching for various organizations’ endorsements of California ballot measures. Finally located some data, and was curious how it would appear as a network showing the organizations and the propositions they support. Was able to scrape data for University of Berkley’s IGS Library Ballot Measure Endorsement page (for Nov. 2008) and create a few network images.
One shows all the positive endorsements:
And the other shows all the negative endorsements:

(The resolution of these images is a little low to read the labels, but they are linked to pdfs)
Cute, but not terribly useful. There does seem to be a bit of structure at least in the negative endorsements. Some clumping of opposition to Props 9,6, 8, and 4. (These are pretty nasty pro-prison, anti-abortion and anti-gay measures.) Also seems to be a cluster around around 10 and 7. I wonder if centrality in these networks would predict win/loss any better than the raw organizational endorsements? Might be interesting to set this up as something interactive, where you could click a measure and highlight the endorsers and relevant text.. There is also some data from past years, so should be possible to do some cluster analysis that would be a bit more rigorous than just the network maps. At first I thought I’d be able to make co-endorsing networks, but even thresholded by numbers of endorsements, the networks were too dense for useful pictures.


