

Dan McFarland is professor in Sociology/Education at Stanford. He has collected lots of “streaming” interaction data of students in classrooms. The data can be used to generate networks with very high temporal resolution (< 1 min). I worked on data processing scripts in java, analysis in R, and on developing visualizations. We also began the SoNIA project partially as a tool for working with this data. Some of the work ended up in publications, available from Dan’s website. Movies showing the networks evolving in time (and more details about the data) are on the SoNIA project page.
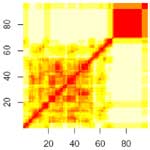 The figure here is a distance matrix of conversation networks extracted as 2.5 minute sliding windows for one class period. Each row (or column) of the matrix shows the comparison of a single slice network to all of the others. White indicates large differences between networks, red means low. Time moves from the lower left to the upper right, so the red diagonal shows that each slice is similar to itself. This picture seems to show a period of varying structure for the first 2/3 of the class, and a final segment that is very different.