Foundation Center’s network funding maps

The Foundation Center (recently?) released a neat web application that provides interactive visualization tools for their database of grant funding. It contains a “Constellation” interactive network view of grant-making relationships.

mapsfoundationcenterSmall

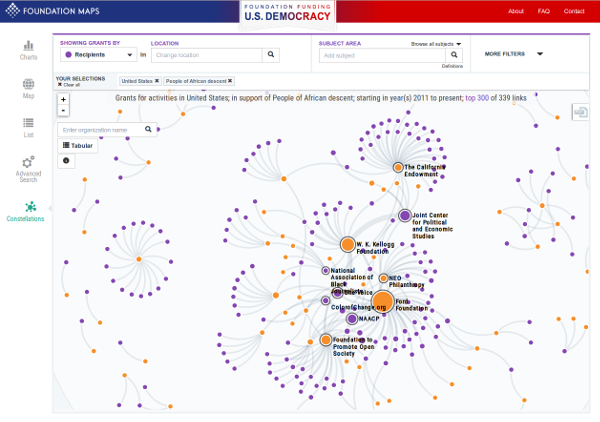
The network map is SVG, built with D3.js, and has a well designed interface with features for refining queries, and flipping between charts, tables, maps, and network views of the same data. Most of the graphic elements can be clicked on to bring up a popup with a more detailed breakdown. The network map is very reminiscent of Angels of the Right (2011), except that they seem to give access to all of the current IRS 990 data (not just conservative foundations) and provide lots of categorization and geocoding as well. Although it seems to be a paid subscription service (with a free trial?), much of the data for the US appears to be available to play with via democracy.foundationcenter.org Note that although the tool does provide CSV data downlaod for some views, this is not open data. The Terms of Service prohibit scraping, bulk download and web redistribution.

One criticism I have — common to many sites using the D3.js network template is — why should the user wait to watch the network layout process in real time? It can be performed so much more quickly in the background, without eating my entire CPU updating the browser DOM when I’m trying to type the next query. Also, I’m not sure exactly what some of the network stats are calculating (sometimes it reports number of connections per vertex < 1, which doesn't seem possible for these networks).

new ndtv release: 0.7

..and continuing in the thread of long-overdue R package updates, we’ve got a new ndtv version out as well.

Peek into the time prism

The package release adds some “whiteboard candy”: 2.5D orthogonal projection of networks in time along a z axis. For lack of a better name, I’ve dubbed it a timePrism (let me know if you find a pre- existing better name). Think of viewing all of the slices from a filmstrip from an angle. Probably hard to follow for large networks (or lots of time slices) but nice for illustrating concepts in temporal networks when you want to convey time and structure and can accept some loss of detail. Especially with the ability to include splines connecting specific vertices for highlighting trajectories.


library(ndtv)
data(toy_epi_sim)  
timePrism(toy_epi_sim,
           orientation=c('z','y','x'), # swap axes
           angle=40,
           spline.v=c(7, 29, 36, 70, 82, 96),  # hilite the infected 
           spline.col='red',
           spline.lwd=2,
           box=FALSE,
           planes=TRUE,  # draw a semi-transparent 'plane' under each net
           vertex.col='ndtvcol'  # use pre-created infection color scheme)

timePrism
Continue reading new ndtv release: 0.7

tsna : Tools for Temporal Social Network Analysis

We finally got the alpha release of the new tsna package up on CRAN! The goal is for the package to be a repository of algorithms and techniques for doing Social Network Analysis on longitudinal networks stored as networkDynamic objects. It includes:

The package vignette has lots more details.

As a quick example, the code below extracts a forward temporal path (think “what is the earliest journey a message could take from vertex 10 to each vertex in the network while respecting edge timing”) and plots it as a transmission tree, including the transmission time for each edge:


# load the libraries
library(tsna)
library(ndtv)
# load a dynamic network example
data("moodyContactSim")
# compute the forward temporal path from vertex 10 at time 0
v10path< -tPath(moodyContactSim,10)
# plotting trees still a little complicated, 
# but with Graphviz and ndtv we can do it
plot(v10path,
    coord=network.layout.animate.Graphviz(as.network(v10path),
          layout.par = list(gv.engine='dot')),
    edge.label.col='blue',
    main='earliest fwd path transmission times from vertex 10')

v10_fwd_path