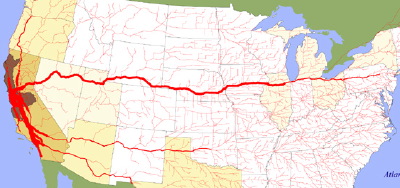
Found this fascinating .gov site that gives visual maps of the freight flows between various cities in the US. Image above is just truck flows from SF/Oakland, but they have for entire states as well. Data is from 1998, most Department of Transportation sources . Also includes similar images for maritime flows and links to commodity flows data sources. Neat to be able to see the distribution network of dependencies connecting the regions like arteries or roots. As if each city extends its transit tendrils to other cities to gather and exchange the “nutrients” (products) it needs to survive.
Continue reading Economic Flows and Vulnerability →
 Despite the mobility and “small world” social connectivity people living in modern culture, regional difference in culture do seem to persist on both the nation and neighborhood levels. The Soda vs. Pop map may have been created almost as a joke, but seems to reveal very real regional divisions in word uses. Obviously, terms for carbonated drinks may not be tightly correlated with other cultural traits, but it is an intriguing image — and quite a relief after the deluge of red-state blue-state political maps based on voting districts.
Continue reading Mapping Culture →
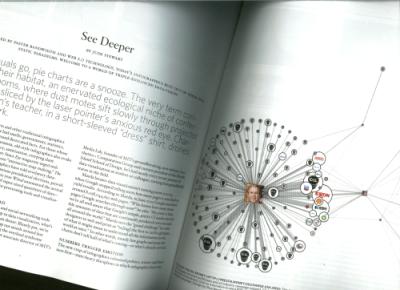
Our oilmoney contribution mapping site was featured with a number of other projects in an article by Jude Stewart in STEP Inside Design magazine’s Nov/Dec 2008 issue. Interesting article. Ironically, as it was the “self promotion issue”, they got the url wrong ;-)
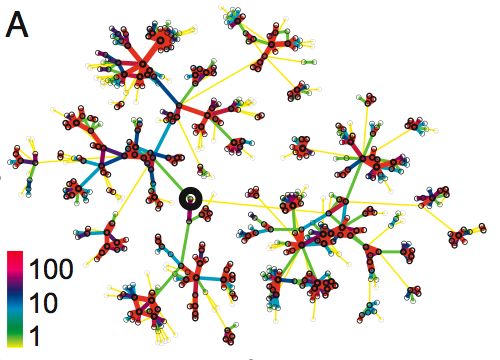
Curiosity about the “shape” of social structure is one of the main factors that got me involved in network visualization in the first place. How “clumpy” and “clique-y” are the patterns of social contacts around me? Continue reading What does social structure look like? →
curiosities of culture, communication & networks
