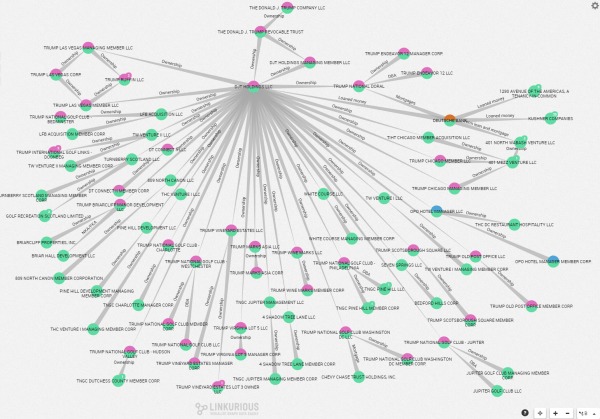
The folks at LittleSis (the opposite of Big Brother) have just released a nice tool for creating “powermaps” using the relationships between entities in their database. Powermaps are an informal term for a type of network graph illustrating various types of relationships between (often multiple types) of people or institutions
The maps are quite lovely, built as zoomable SVG objects embedded in the webpage with elegant highlighting and mouse-over label reveals. The entities on screen supporting clicking through to the corresponding page in the LittleSis database. From peeking at the Oiligrapher source code on github it appears that the tool makes heavy use of d3 (of course) and some of the force-directed network layout code. They cite Mark Lombardi as a strong influence for the visual aesthetic. Not sure about speed/performance issues on larger networks, but this seems like a great tool for these types of relatively sparse illustrations.
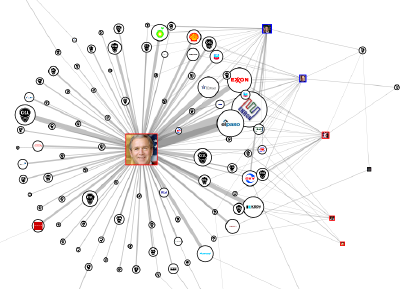
I recently installed Mozilla’s Collusion add-on for Firefox. It maps out the set of information-sharing relationships between sites as you visit them and they install various 3rd-party-cookies to track your browsing history. Has a neat interactive network viz as a browser plugin where so you can highlight sites you’ve visit and who they reported to.
This image was after a week of low-intensity computer use. Not that surprising to see Google, Facebook and Twitter as very central nodes, tho still impressive to have an image of how many sites report to them. Some sites like quantserve.com I’d at least heard of before, but not some of the other central stats players like 2o7.net or media6degrees.com or imrworldwide.com that appeared lurking in the network.
The visualization seems to be built in SVG using the D3 library’s network code. The interactivity and design are quite lovely, at least for small networks. However, now that I’ve been running Collusion for a month, the graph is quite large and the animation is getting painfully slow and eating my CPU.
Just in case you think that entity resolution problems (matching up names appearing in multiple data sources, while not falsely assuming that everyone named “John Smith” is the same person) are purely an academic concern, I recently got an email from an airline announcing TSA’s new Secure Flight program and asking me to provide them with birth date and gender information when making a reservation: Continue reading New years entity resolutions→
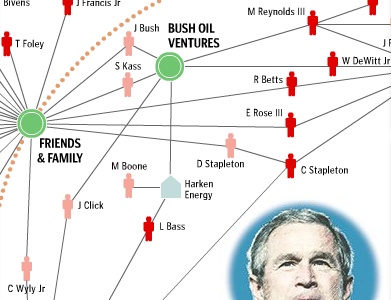
Well, it has not been officially launched yet, but the oil company campaign contribution site we’ve been working on for the last six months is live. It leaked out on blogs this week, and has been getting good reviews and tons of traffic. We are excited! The site is a project of Oil Change International and another collaboration between myself and Greg Michalec. It shows interactive network maps of campaign contributions to presidential races and members of congress. The same data is also shown in drillable tables, so you can go from a politician, to the contributing oil companies, all the way to the image of the original FEC filing. It also permits searching for congress members by name and constituent zip code.
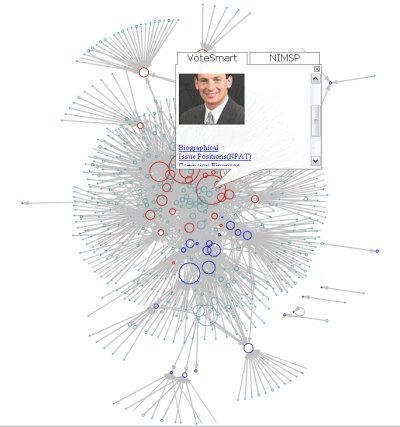
This month Berkley-based non-profit MAPLight.org expanded their coverage of the relationships between interest groups, legislators and votes to include data for US Congress.
MAPLight.org for Congress combines all campaign contributions to U.S. legislators with legislators’ votes on every bill, using official records from the Library of Congress web site and the nonpartisan Center for Responsive Politics (OpenSecrets.org). The resulting database of bills, voting records, and campaign contributions powers the search engine at MAPLight.org and enables people to see the links between dollars spent and votes cast in Washington D.C. [maplight press release]
Maplight is doing some serious legwork to augment the CRP data with industry positions on bills. They are also doing neat things with timelines so that the user can get a better idea of the relations between donations and key votes.
I’ve been thinking for a while about using a methodology called Principal Component Analysis (PCA) to create visual comparisons between various political candidates. Finally stole a few minutes to give it a shot using industry sector contributions to the current presidential races.
This was done as an entry in the Sunlight Foundations Mashup Contest. Cross your fingers that we win and get some resources to continue the project! ;-) Continue reading Unfluence Project Launched!→
Source: SunshineWeek.org
On March 14, the U.S. House of Representatives “passed three bills to open government records to the public, brushing aside White House opposition, and in one case, a veto threat.” The bills “would force government to be more responsive to Freedom of Information Act requests, make contributions to presidential libraries public and overturn a 2001 presidential directive giving the president authority to keep his records from public view,” reports Associated Press.


 source: