
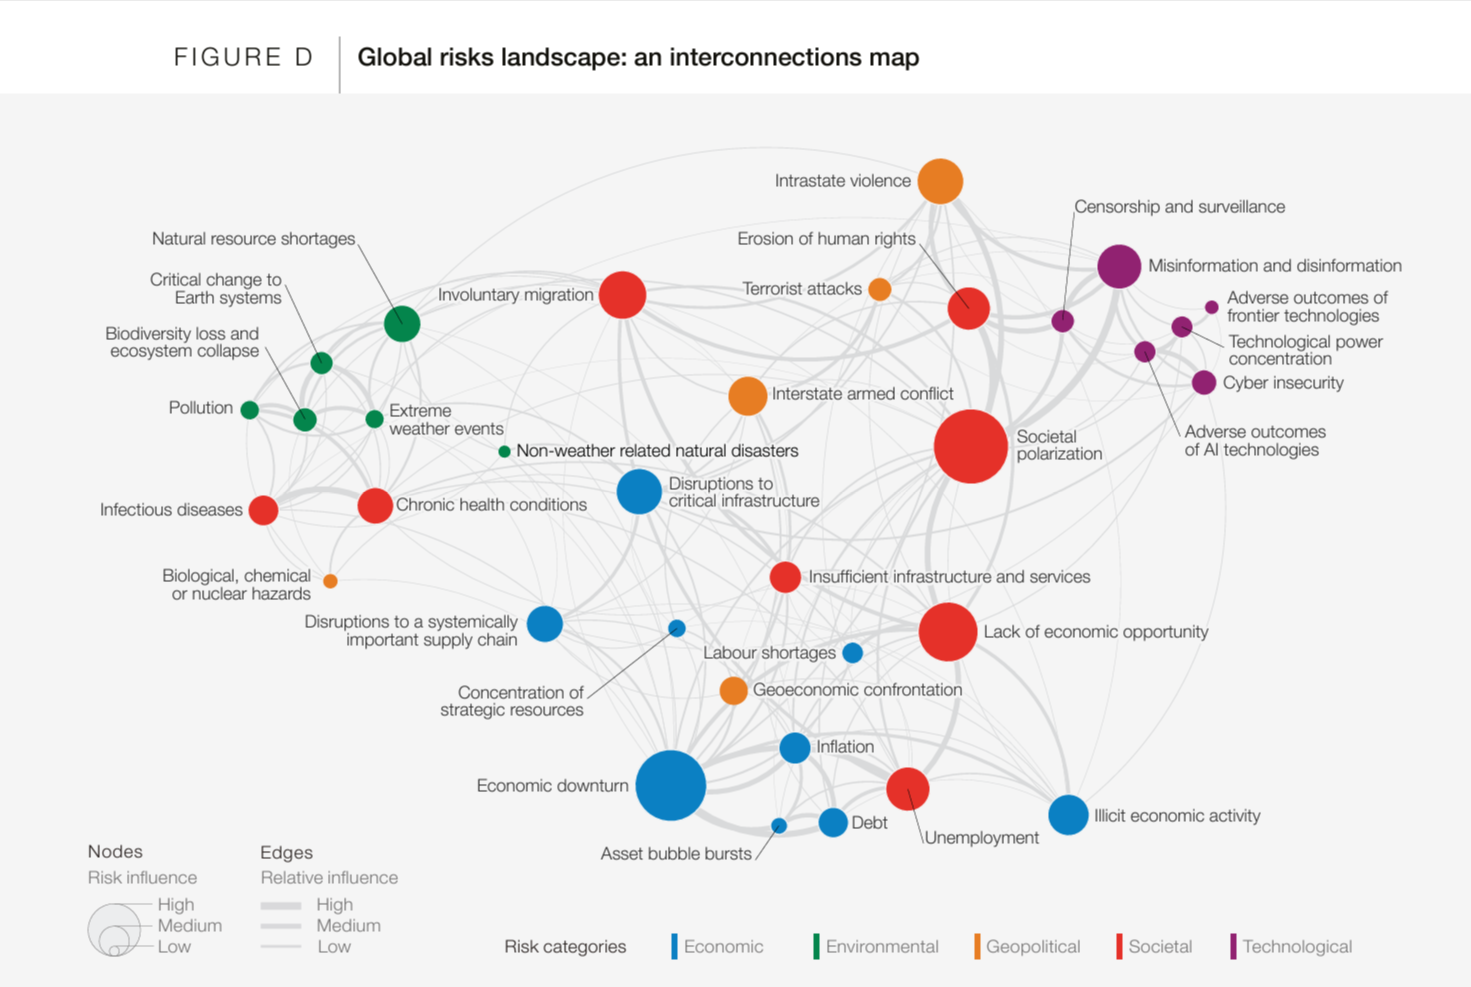
A colleague shared this neat network graphic depicting the interconnections among different kinds of risks (from the perspective of the World Economic Forum) The original document https://www3.weforum.org/docs/WEF_The_Global_Risks_Report_2024.pdf presents some details about how/who they surveyed to get numbers on relative magnitude of risks. But I couldn’t find any details about where the relationship data about how strongly the risks are coupled together comes from. Even if someone just made it up from the seat of their pants I think it is cool to illustrate that there are a lot of moving parts.
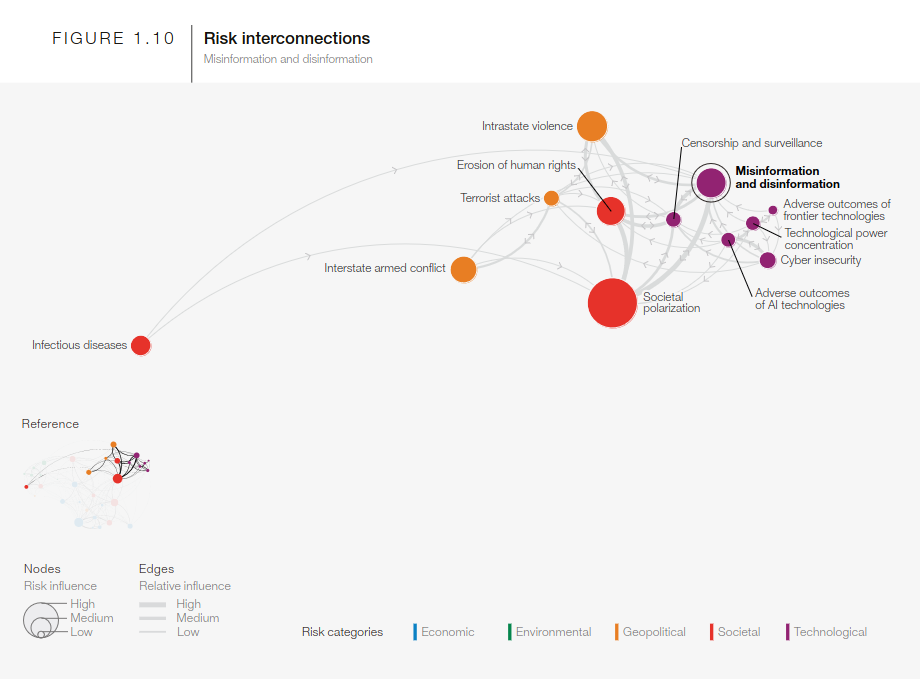
The report also need a nice narrative technique of using “hilited” excerpts of the graphic to illustrate each of the subtopic clusters in the report.
(yay, this blog still works! ;-)