Commerce info tracking, etc

Nice idea, building collaborative software for tagging and tracking commercial products. “Network of Integrated Consumer Knowledge” Eugene based software co. http://www.grasscommons.org/

Grass Commons, a 501(c)3 public interest charity, is building pipelines between those who can generate information about products and companies and those who can use that information to build a more sustainable economy and a better world.

Grasscommons seems to have a collaborative relationship with Hooze,

Hooze.org is about collaborating to gather useful, reliable info about the products and companies that are shaping our world.

Hooze is the world’s first public wagging site. Wagging combines wiki and tagging in unique ways so that communities of users can organically develop ways of organizing and presenting information. The combo cards at the bottom of this page are an example of how wagging differs from other tools.

And also seems to be building tools like data integration engines. Not only that, but also researching for open-source licensing for structured data. Something that would be very important for an organization that would like to curate data and provide it to the public…

Krugal Code Search Engine

Krugal seems to be a nice project for searching code snips and algorithm implementations.  Currently mostly sourceforge stuff, I found some very familiar code ;-)  also alternate implementations I’d like to look at in detail

Krugle is designed to locate code. Krugle supports code search by crawling, parsing and indexing code found in all open source repositories, as well as code that exists in archives, mailing lists, blogs, and web pages. (http://corp.krugle.com/product/index.html)

Definitly still in beta, but seems to work pretty well.

PajekConverter

PajekConverter is a basic utility (written in Java) for converting tab-delineated text files into a format readable by the network analysis and visualization software Pajek. Pajek is Windows-based freeware, written by Vladimir Batagelj and Andrej Mrvar, University of Ljubljana, Slovenia Downloadable from: vlado.fmf.uni-lj.si/pub/networks/pajek/

PajekConverter was written by skye for John Padgett, University of Chicago.
Bugs and Questions to:
skyebend@santafe.edu


Version 1.2 9/3/01 Added ability to parse external .txt files, some fixes
Download PajekConverter v1.2 and documentation (ZIP compressed jar)
View documentation (*.txt)
Download Java source code (ZIP file)

CSDE: Techniques for Visualizing Transmission in Dynamic Networks

simMovieImgDr. Martina Morris (PI) & Dr. Mark Handcock at the Center for Studies in Demography and Ecology of University of Washington are funding a SoNIA-related project contract to integrate dynamic network visualization techniques with the R statnet package developed by Morris, Handcock, et al at the CSDE. The funds come from the NIH grants supporting the Network Modeling Project at the University of Washington (grants R01 HD41877 and R01 DA12831)
The focus is on adapting and developing visualization techniques for dynamic network data. The specific emphasis will be on techniques relevant for understanding:

a) infectious disease transmission (change in state of elements due to a network diffusion process) and

b) the stationary dynamics (model-based addition and removal of nodes/edges) of longitudinal network data and simulation output.

The goal is to develop robust, rigorous and repeatable procedures for visually interpreting time-based network data. We will achieve this by linking existing software components and improving existing techniques to generate animations and export movies from R or other statistical packages into standard formats suitable for use in presentations or websites.

ATA SpA

I worked for a year or so as a consultant at ATA SpA in Lucca Italy. ATA (now defunct) was a academic spinoff/tech startup that works with various kinds of networks. Especially networks relevant to the bio-pharma industry, such as patent citations, term co-occurrence in medical journal abstracts, co-authorship, etc. Overall the goal was to come up with systematic techniques for creating overviews research domains (or other proprietary DBs) that allow the user to locate interesting regions and then inspect the underlying data. This is an area many researchers are focusing on, but I think part of what was innovative about ATA’s Dynet project was its focus on networks that are evolving in time.

Continue reading ATA SpA

McFarland’s Classroom Networks


Dan McFarland is professor in Sociology/Education at Stanford. He has collected lots of “streaming” interaction data of students in classrooms. The data can be used to generate networks with very high temporal resolution (< 1 min). I worked on data processing scripts in java, analysis in R, and on developing visualizations. We also began the SoNIA project partially as a tool for working with this data. Some of the work ended up in publications, available from Dan’s website. Movies showing the networks evolving in time (and more details about the data) are on the SoNIA project page.

Temporal Similarity plot of McFarland classroom networks
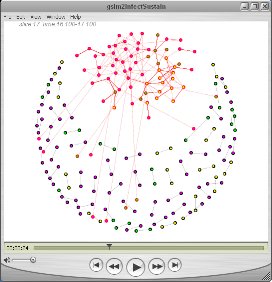
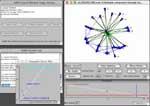
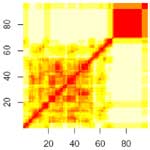
The figure here is a distance matrix of conversation networks extracted as 2.5 minute sliding windows for one class period. Each row (or column) of the matrix shows the comparison of a single slice network to all of the others. White indicates large differences between networks, red means low. Time moves from the lower left to the upper right, so the red diagonal shows that each slice is similar to itself. This picture seems to show a period of varying structure for the first 2/3 of the class, and a final segment that is very different.

Dynamic Network Visualization

Moody, McFarland, Bender-deMoll (2005) “Dynamic Network Visualization“ American Journal of Sociology, volume 110 , pages 1206–1241

Abstract:

DNV_AJS_thumbIncreased interest in longitudinal social networks and the recognition that visualization fosters theoretical insight create a need for dynamic network visualizations, or network “movies.” This article confronts theoretical questions surrounding the temporal representations of social networks and technical questions about how best to link network change to changes in the graphical representation. The authors divide network movies into (1) static flip books, where node position remains constant but edges cumulate over time, and (2) dynamic movies, where nodes move as a function of changes in relations. Flip books are particularly useful in contexts where relations are sparse. For more connected networks, movies are often more appropriate. Three empirical examples demonstrate the advantages of different movie styles. A new software program for creating network movies is discussed in the appendix.

Sbandata! 2005

Yet Another Account of Skye Crashing Around with Large Groups of Strange Loud People and Understanding Very Little

from an email I sent in may 2005

The third Sbandata, an insane convergence of street bands, mostly brass bands, from italy and europe.

This year it was in Rome. It was madness. I was only there saturday and sunday, which is probably good, ’cause I don’t know if I would have survived three days. Either I would have lost my hearing or floated off into the stratosphere supported by an angelic chorus of baritone horns.

Imagine if Kustritza was asked to throw a civic event …..

sbandata poster
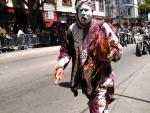
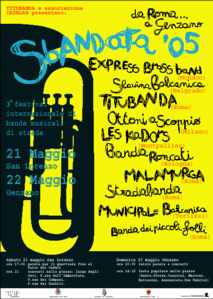
If I understand right, “sbandata” means something like “to drift” or “to swerve” as in “the drunken musicians swerved into the street, colliding with pedestrians and tangling traffic with continuous high-decibal acoustic music and general joyus mayhem”. Or something like “he falls in love but lost the mind and is wandering in the street.” Very apt description. I don’t really know much about who did the organizing, I think the coordination was done by folks from the Roman band Titubanda (probably the best street band in Italy), with some financial support from the city of Rome. I think the city gave us the food and wine anyway, as well as somehow supporting/permiting the squated/ceeded ex-elementary school where we slept (those of us who did) on the floor. Everything seemd to appear magically out of delightful anarchy.

Continue reading Sbandata! 2005

SoNIA (Social Network Image Animator)

soniaShot.jpg SoNIA is a Java-based package for visualizing dynamic or longitudinal “network” data. By dynamic, we mean that in addition to information about the relations (ties) between various entities (actors, nodes) there is also information about when these relations occur, or at least the relative order in which they occur.

Some examples..

The source code is on the sourceforge site.