
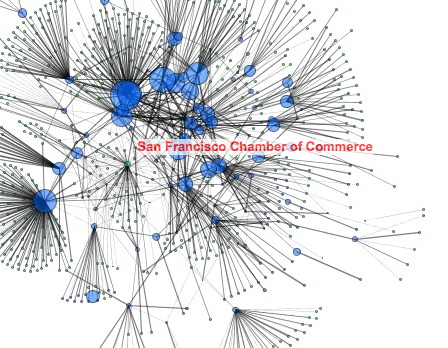
 I’m very interested in trying to figure out ways to map the political landscapes and power structures that are operating around us. I’d like to be able to see various organizations and political actors in the context of their allies, enemies, and supporters in order to understand where the political boundaries are between various factions.
Continue reading San Francisco Political Contributions
Category Archives: network viz
Network of ballot measure endorsements
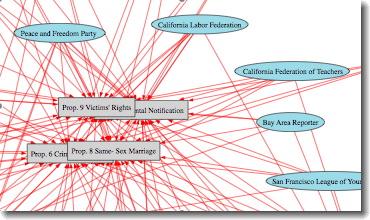
It is election day! Fingers crossed…. ;-) Before today I was searching for various organizations’ endorsements of California ballot measures. Finally located some data, and was curious how it would appear as a network showing the organizations and the propositions they support. Was able to scrape data for University of Berkley’s IGS Library Ballot Measure Endorsement page (for Nov. 2008) and create a few network images.
Economic Flows and Vulnerability
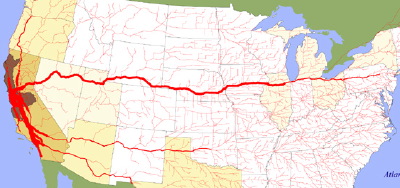
Found this fascinating .gov site that gives visual maps of the freight flows between various cities in the US. Image above is just truck flows from SF/Oakland, but they have for entire states as well. Data is from 1998, most Department of Transportation sources . Also includes similar images for maritime flows and links to commodity flows data sources. Neat to be able to see the distribution network of dependencies connecting the regions like arteries or roots. As if each city extends its transit tendrils to other cities to gather and exchange the “nutrients” (products) it needs to survive.
Continue reading Economic Flows and Vulnerability
What does social structure look like?
Curiosity about the “shape” of social structure is one of the main factors that got me involved in network visualization in the first place. How “clumpy” and “clique-y” are the patterns of social contacts around me? Continue reading What does social structure look like?
dynamicnetwork JSS Paper
Well shoot, I guess it is publication week! The special issue of the Journal of Statistical Software about the statnet package for advanced network statistics has finally been released. It is great to see the years of hard work from everyone on the statnet team finally in print! I did some work for the project to hook up the package with SoNIA software to create movies from output of statistical models of dynamic networks of disease transmission. One of the articles in the issue documents the process and includes some example movies:
Skye Bender-deMoll, Martina Morris, James Moody (2008) “Prototype Packages for Managing and Animating Longitudinal Network Data: dynamicnetwork and rSoNIA” Journal of Statistical Software. Vol. 24, Issue 7.
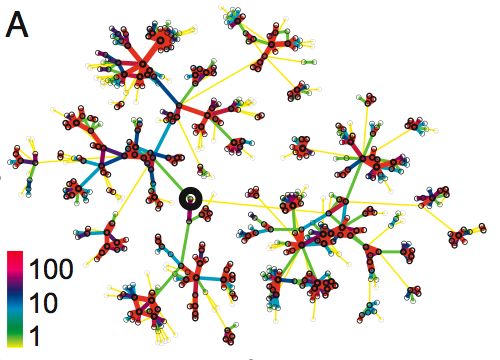
One of the exciting things for me about the project was exploring ways to display time, connectivity, and transmission simultaneously. An example of one of the movies demonstrating the effects of varying levels of “concurrent partnerships” on the paths of transmission of simulated “infection”: (70mb quicktime movie). In the last few frames of the movie, the perspective shifts to show a timeline image of the infection “trees” in occurring in the simulated network.
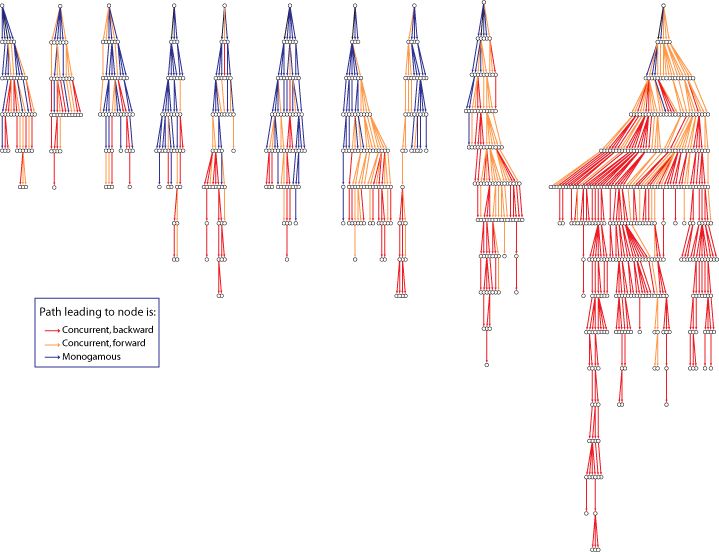 In the tree image (created by James Moody) time advances vertically down the page, so the seed nodes for each infection appear at the top and the “depth” of the tree indicates the time step of the infection. The color of each edge indicates the concurrency status of the corresponding relationship when the transmission occurred.
Network Mapping for Human Rights
[NOTE: as of 2013, AAAS network mapping is offline, links have been altered to point to Internet Archive versions]
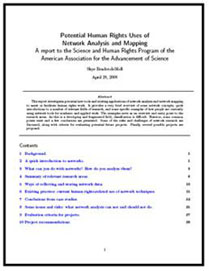
Well, its several months overdue, but I finally finished my report to the AAAS Science and Human Rights Program on network analysis and mapping. The goal was to give a non-academic introduction to network concepts and related fields, survey some relevant academic and humanitarian projects, and make some proposals.
Potential Human Rights Uses of Network Analysis and Mapping:
A report to the Science and Human Rights Program of the American Association for the Advancement of Science (pdf, 47p)
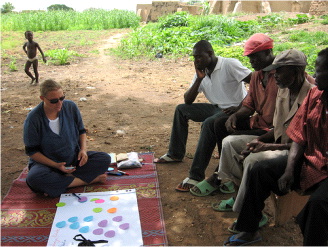
The report also includes a number of visual examples (thanks to the authors for allowing me to include samples of their work). Also thanks to the members of the SOCNET listserv for recommendations. It was really great to have an opportunity to discover what work is being done, and dig up interesting data sets and applications (see grassroots network mapping, I’ll post others as well). At the same time, I’m sure there are a number of worthy and relevant projects that I have overlooked, so please contact me or SHRP with more examples.
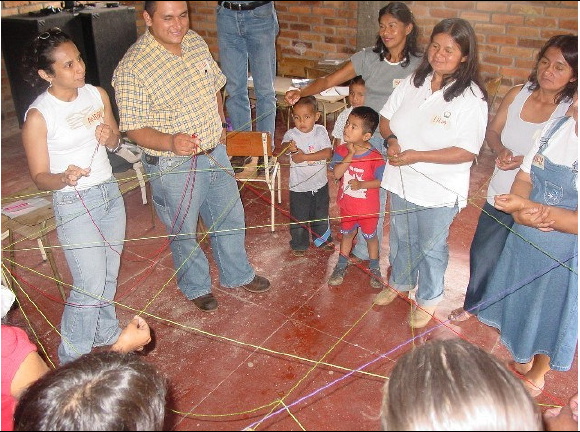
One lovely network visualization included was this above. It shows warm-up exercise for participants in a network mapping workshop for a Colombian farmer collective. Colored wool was used to represent the various communication paths by which participants received invitations to the workshop. (From B. Douthwaite, A. Carvajal, S. Alvarez, E. Claros, and L.A. Hernández. “Building farmers’ capacities for networking (Part I): Strengthening rural groups in Colombia through network analysis.” Knowledge Management for Development Journal, 2(2), 2006.
Follow-the-oilmoney lives!
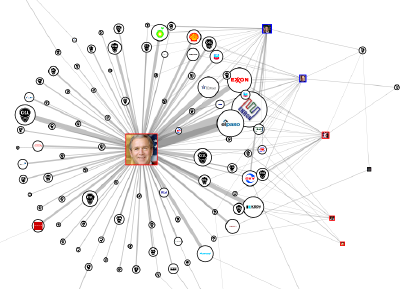
Well, it has not been officially launched yet, but the oil company campaign contribution site we’ve been working on for the last six months is live. It leaked out on blogs this week, and has been getting good reviews and tons of traffic. We are excited! The site is a project of Oil Change International and another collaboration between myself and Greg Michalec. It shows interactive network maps of campaign contributions to presidential races and members of congress. The same data is also shown in drillable tables, so you can go from a politician, to the contributing oil companies, all the way to the image of the original FEC filing. It also permits searching for congress members by name and constituent zip code.
Grassroots network mapping
 I’m working on a project for AAAS’s Science and Human Rights Program to identify some possibilities for human rights uses of networks and network visualization. In the process of doing a quick web review of existing work, I located a couple of interesting examples of people using networks as a grassroots tool to help stakeholders develop analysis of the power networks they are embedded in as a strategy tool. Also great to see such a low-tech solution.
Continue reading Grassroots network mapping
Oil Networks, Advertising, Imaginary Data?
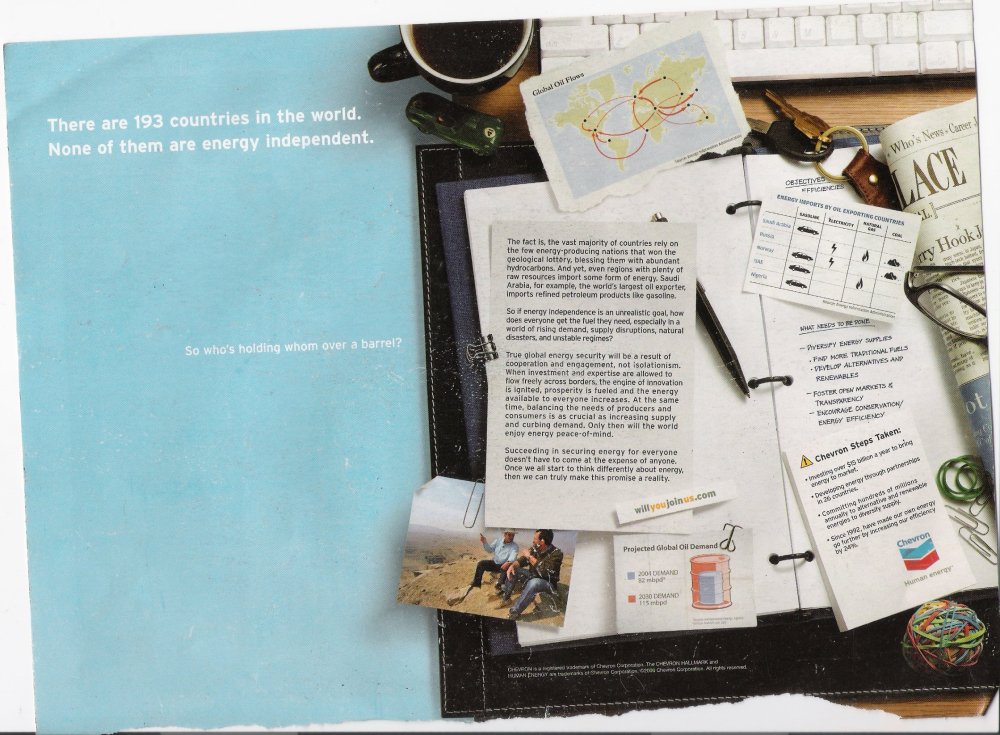
![]() I found an interesting Chevron advertisement inside the back cover of the July 2007 issue of Harper’s magazine. Captioned “There are 193 countries in the world. None of them are energy independent.” it depicts an open notebook with clippings of a number of graphics and charts showing information about energy interdependence.
I found an interesting Chevron advertisement inside the back cover of the July 2007 issue of Harper’s magazine. Captioned “There are 193 countries in the world. None of them are energy independent.” it depicts an open notebook with clippings of a number of graphics and charts showing information about energy interdependence.
![]()
Continue reading Oil Networks, Advertising, Imaginary Data?
Organic Brand Ownership Networks

A friend of mine recently found a map of ownership relationships in the organic food industry pinned up in a neighbor’s kitchen. A bit of searching led us to Phil Howard‘s work tracking the growth and mergers of companies and brands. He kindly shared his data with me so we could use SoNIA to make a network animation showing major brand introductions and ownership relations from 1995 to 2007.
Continue reading Organic Brand Ownership Networks